
diff options
Diffstat (limited to 'content/blog/2020-07-20-video-game-sales.md')
| -rw-r--r-- | content/blog/2020-07-20-video-game-sales.md | 181 |
1 files changed, 181 insertions, 0 deletions
diff --git a/content/blog/2020-07-20-video-game-sales.md b/content/blog/2020-07-20-video-game-sales.md new file mode 100644 index 0000000..bff90a8 --- /dev/null +++ b/content/blog/2020-07-20-video-game-sales.md @@ -0,0 +1,181 @@ ++++ +date = 2020-07-20 +title = "Data Exploration: Video Game Sales" +description = "Exploring and visualizing data with Python." ++++ + +# Background Information + +This dataset (obtained from +[Kaggle](https://www.kaggle.com/gregorut/videogamesales/data)) contains +a list of video games with sales greater than 100,000 copies. It was +generated by a scrape of vgchartz.com. + +Fields include: + +- Rank: Ranking of overall sales +- Name: The game name +- Platform: Platform of the game release (i.e. PC,PS4, etc.) +- Year: Year of the game's release +- Genre: Genre of the game +- Publisher: Publisher of the game +- NA~Sales~: Sales in North America (in millions) +- EU~Sales~: Sales in Europe (in millions) +- JP~Sales~: Sales in Japan (in millions) +- Other~Sales~: Sales in the rest of the world (in millions) +- Global~Sales~: Total worldwide sales. + +There are 16,598 records. 2 records were dropped due to incomplete +information. + +# Import the Data + +```python +# Import the Python libraries we will be using +import pandas as pd +import numpy as np +import seaborn as sns; sns.set() +import matplotlib.pyplot as plt + +# Load the file using the path to the downloaded file +file = r'video_game_sales.csv' +df = pd.read_csv(file) +df +``` + +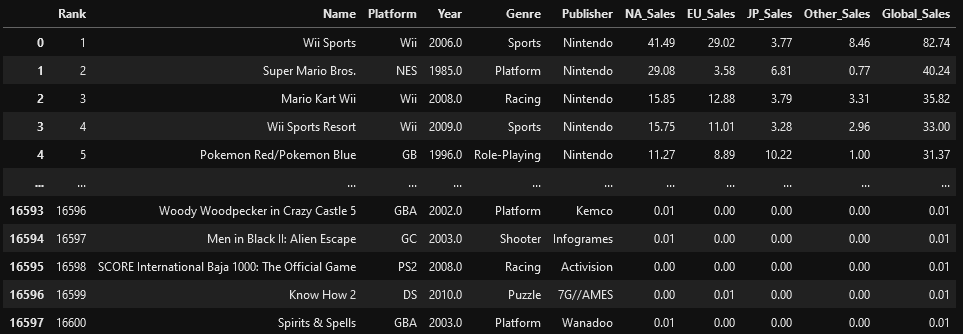 + +# Explore the Data + +```python +# With the description function, we can see the basic stats. For example, we can also see that the 'Year' column has some incomplete values. +df.describe() +``` + +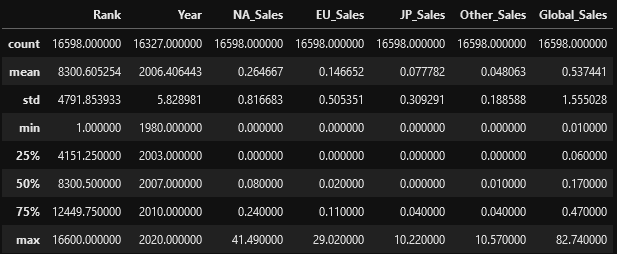 + +```python +# This function shows the rows and columns of NaN values. For example, df[179,3] = nan +np.where(pd.isnull(df)) + +(array([179, ..., 16553], dtype=int64), + array([3, ..., 5], dtype=int64)) +``` + +# Visualize the Data + +```python +# This function plots the global sales by platform +sns.catplot(x='Platform', y='Global_Sales', data=df, jitter=False).set_xticklabels(rotation=90) +``` + +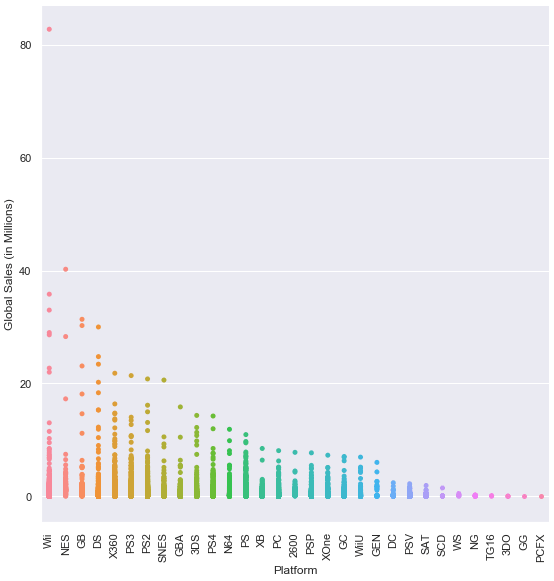 + +```python +# This function plots the global sales by genre +sns.catplot(x='Genre', y='Global_Sales', data=df, jitter=False).set_xticklabels(rotation=45) +``` + +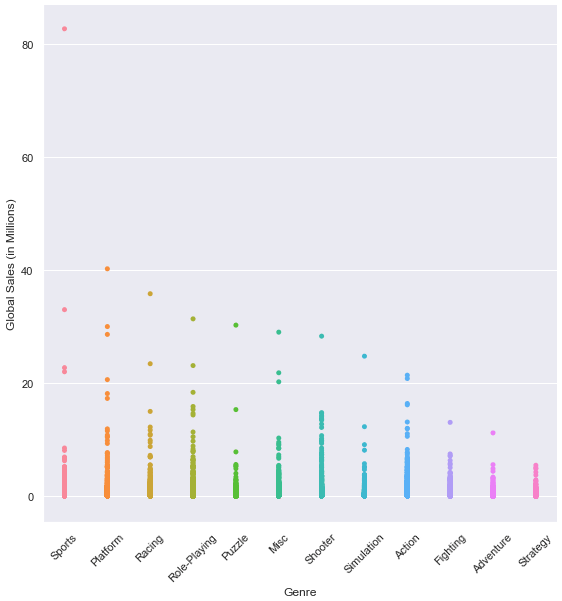 + +```python +# This function plots the global sales by year +sns.lmplot(x='Year', y='Global_Sales', data=df).set_xticklabels(rotation=45) +``` + +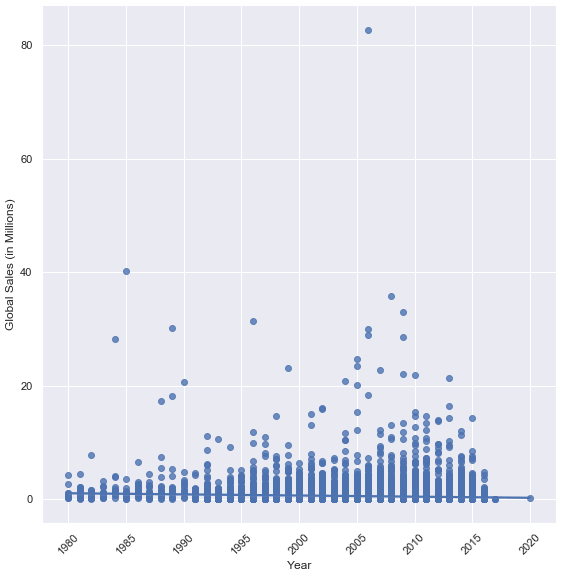 + +```python +# This function plots four different lines to show sales from different regions. +# The global sales plot line is commented-out, but can be included for comparison +df2 = df.groupby('Year').sum() +years = range(1980,2019) + +a = df2['NA_Sales'] +b = df2['EU_Sales'] +c = df2['JP_Sales'] +d = df2['Other_Sales'] +# e = df2['Global_Sales'] + +fig, ax = plt.subplots(figsize=(12,12)) +ax.set_ylabel('Region Sales (in Millions)') +ax.set_xlabel('Year') + +ax.plot(years, a, label='NA_Sales') +ax.plot(years, b, label='EU_Sales') +ax.plot(years, c, label='JP_Sales') +ax.plot(years, d, label='Other_Sales') +# ax.plot(years, e, label='Global_Sales') + +ax.legend() +plt.show() +``` + +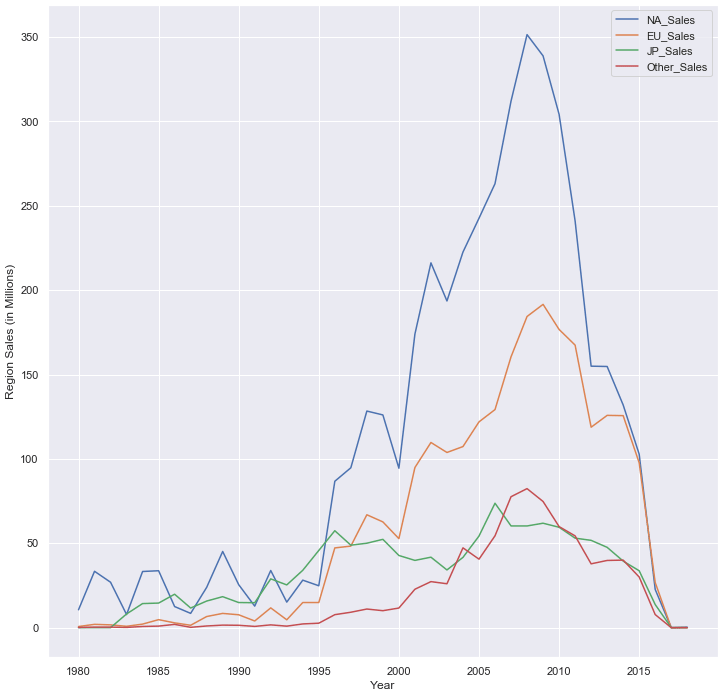 + +# Investigate Outliers + +```python +# Find the game with the highest sales in North America +df.loc[df['NA_Sales'].idxmax()] + +Rank 1 +Name Wii Sports +Platform Wii +Year 2006 +Genre Sports +Publisher Nintendo +NA_Sales 41.49 +EU_Sales 29.02 +JP_Sales 3.77 +Other_Sales 8.46 +Global_Sales 82.74 +Name: 0, dtype: object + +# Explore statistics in the year 2006 (highest selling year) +df3 = df[(df['Year'] == 2006)] +df3.describe() +``` + +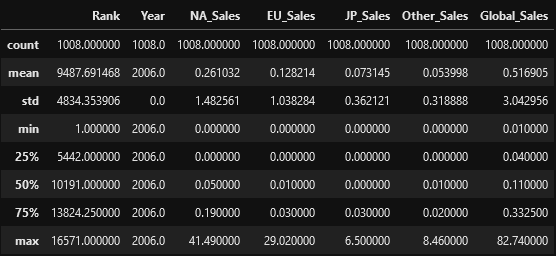 + +```python +# Plot the results of the previous dataframe (games from 2006) - we can see the year's results were largely carried by Wii Sports +sns.catplot(x="Genre", y="Global_Sales", data=df3, jitter=False).set_xticklabels(rotation=45) +``` + +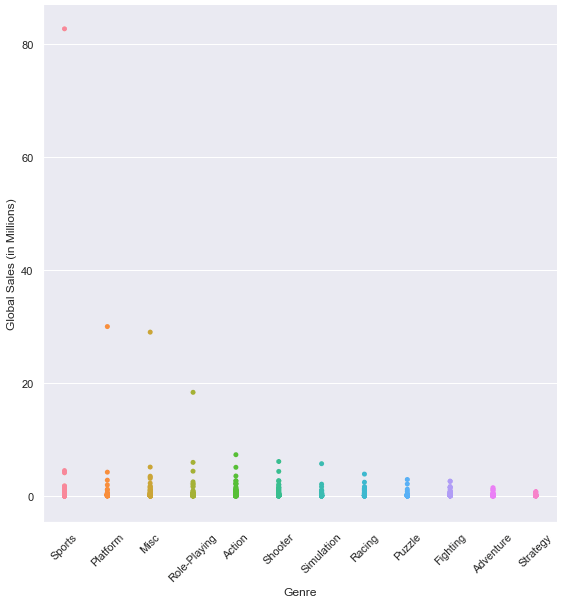 + +```python +# We can see 4 outliers in the graph above, so let's get the top 5 games from that dataframe +# The results below show that Nintendo had all top 5 games (3 on the Wii and 2 on the DS) +df3.sort_values(by=['Global_Sales'], ascending=False).head(5) +``` + +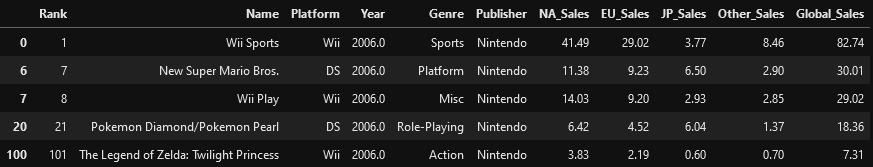 + +# Discussion + +The purpose of exploring datasets is to ask questions, answer questions, +and discover intelligence that can be used to inform decision-making. +So, what have we found in this dataset? + +Today we simply explored a publicly-available dataset to see what kind +of information it contained. During that exploration, we found that +video game sales peaked in 2006. That peak was largely due to Nintendo, +who sold the top 5 games in 2006 and has a number of games in the top-10 +list for the years 1980-2020. Additionally, the top four platforms by +global sales (Wii, NES, GB, DS) are owned by Nintendo. + +We didn't explore everything this dataset has to offer, but we can tell +from a brief analysis that Nintendo seems to rule sales in the video +gaming world. Further analysis could provide insight into which genres, +regions, publishers, or world events are correlated with sales. |