
diff options
Diffstat (limited to 'content/blog/2024-01-27-tableau-dashboard.md')
| -rw-r--r-- | content/blog/2024-01-27-tableau-dashboard.md | 14 |
1 files changed, 7 insertions, 7 deletions
diff --git a/content/blog/2024-01-27-tableau-dashboard.md b/content/blog/2024-01-27-tableau-dashboard.md index 71721fd..2f1e73d 100644 --- a/content/blog/2024-01-27-tableau-dashboard.md +++ b/content/blog/2024-01-27-tableau-dashboard.md @@ -42,7 +42,7 @@ nano data_processing.py Within the Python script, paste the following: -``` python +```python # Import modules import pandas as pd import glob @@ -122,12 +122,12 @@ drag it into the `Columns` or `Rows` area of the canvas. See below for the map visualization. You can recreate this by adding the following fields: -- `Columns`: Lon -- `Rows`: Lat -- `Marks`: - - Description - - Datetime -- `Filters`: Datetime +- `Columns`: Lon +- `Rows`: Lat +- `Marks`: + - Description + - Datetime +- `Filters`: Datetime 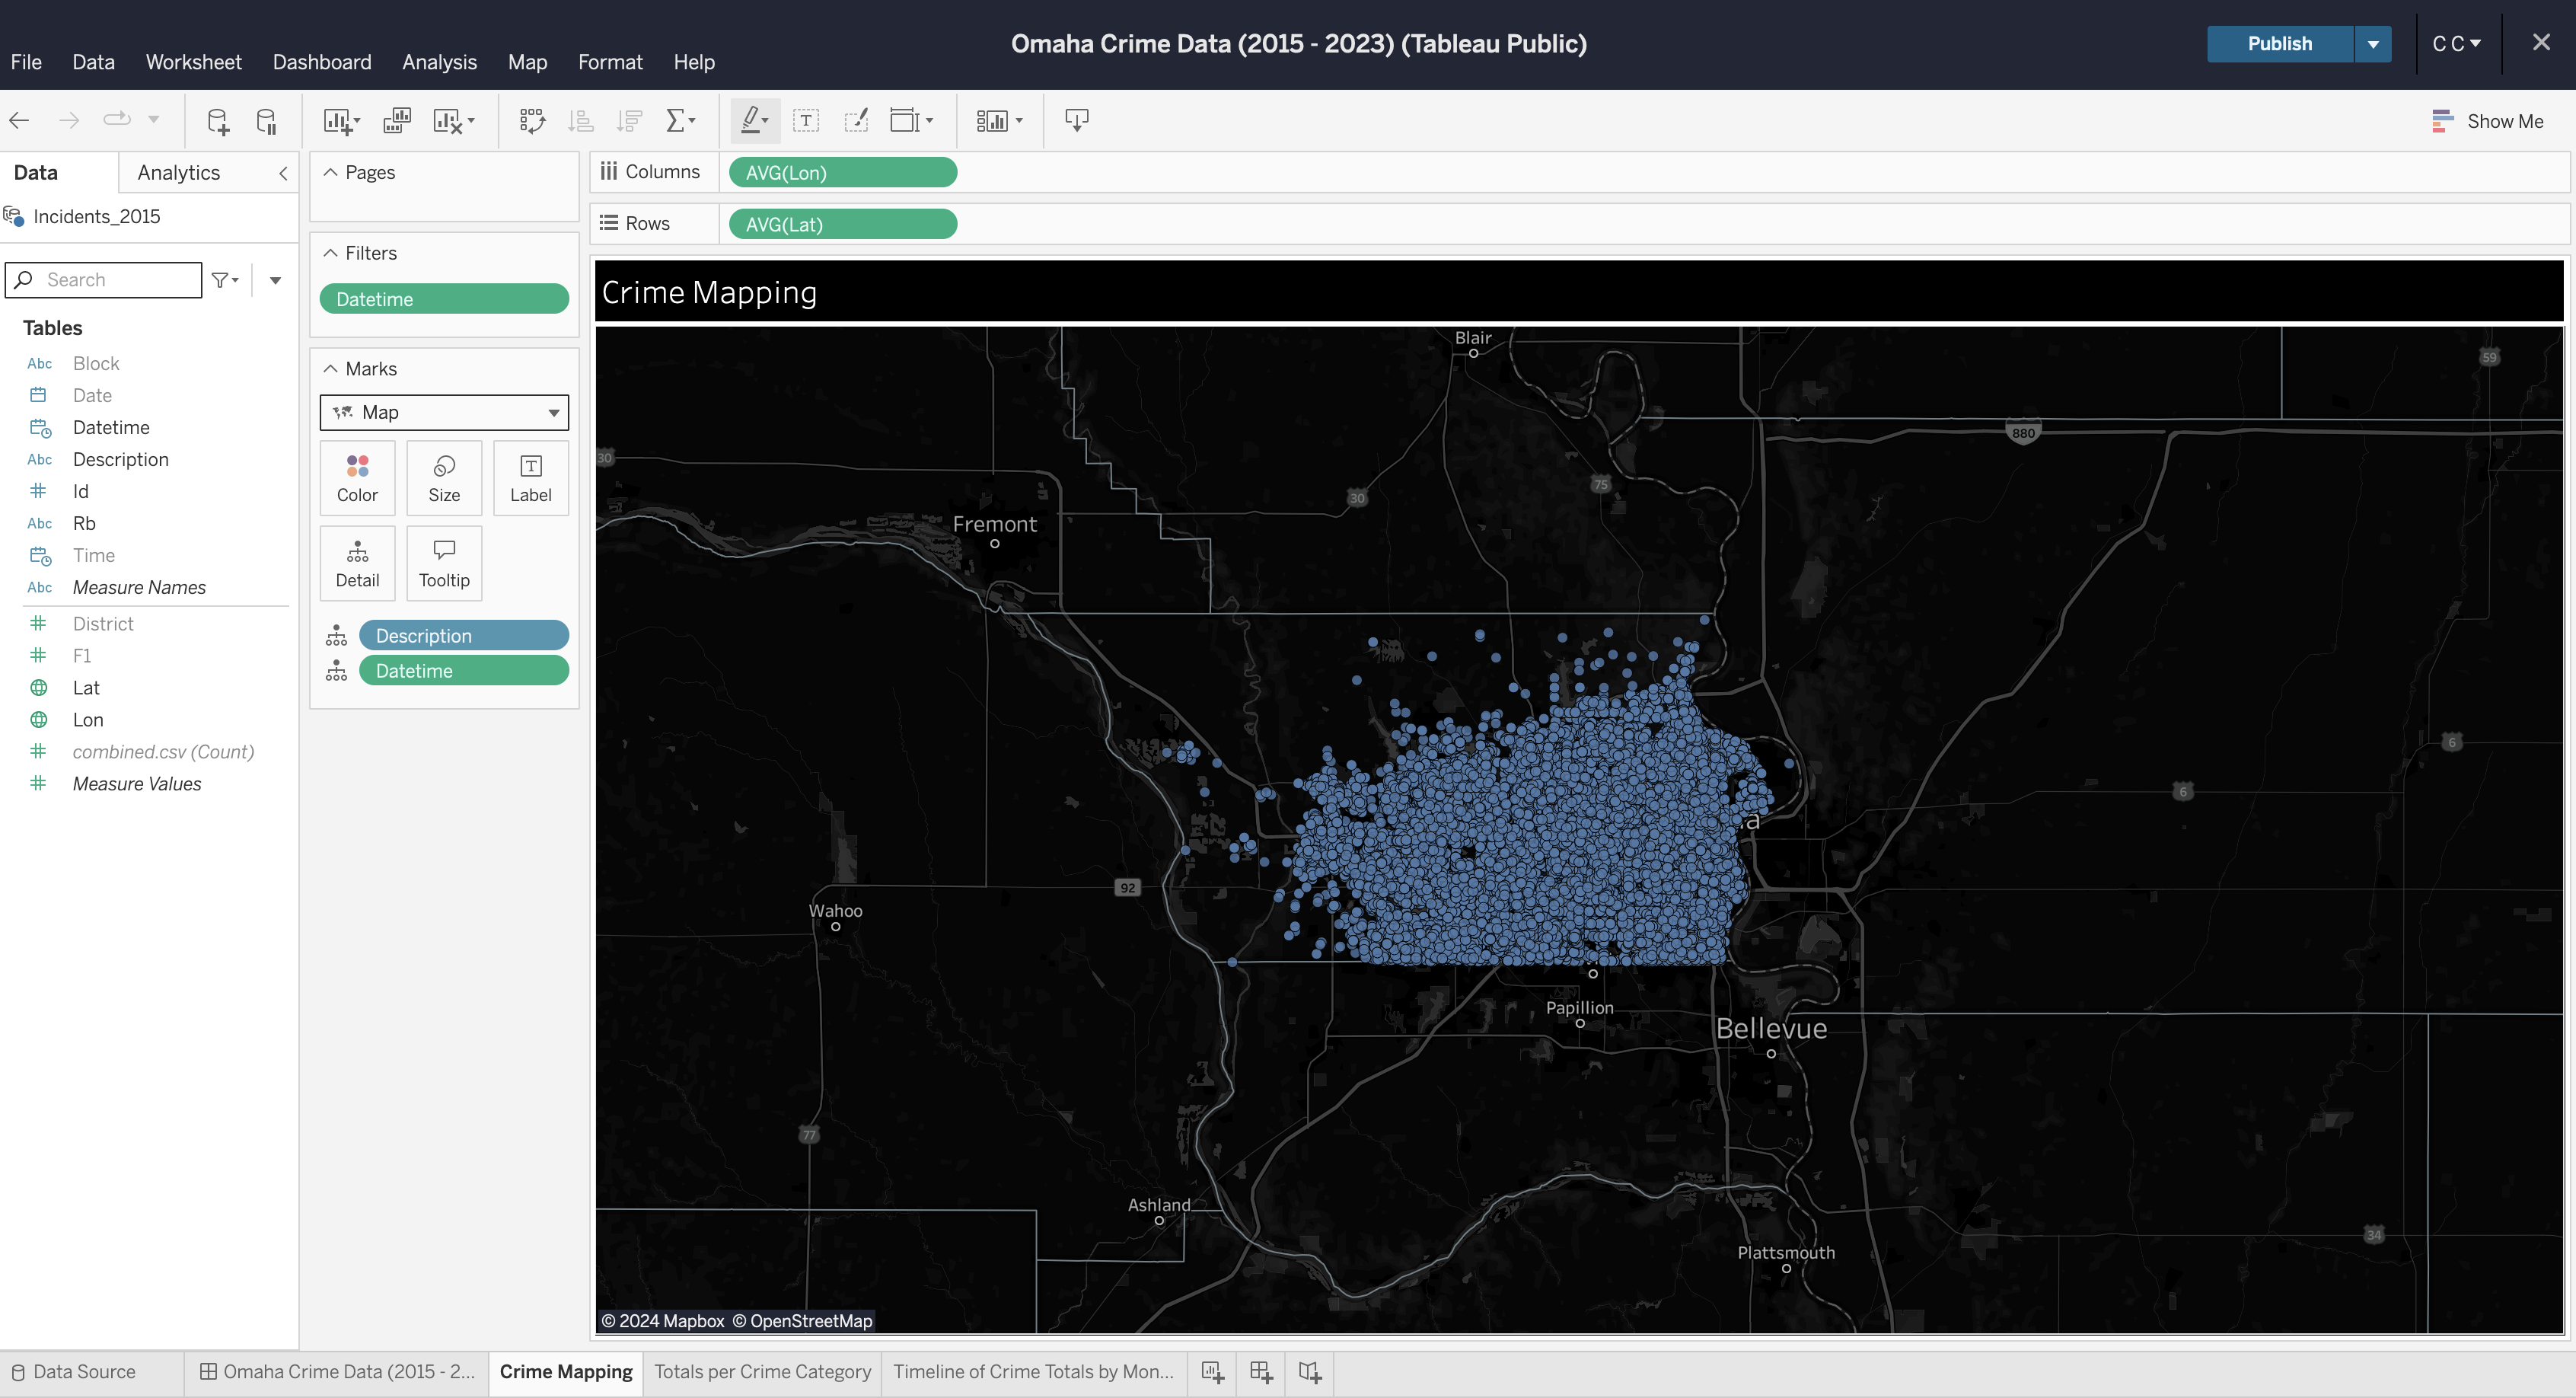 |