
diff options
| author | Christian Cleberg <hello@cleberg.net> | 2024-07-08 20:31:42 -0500 |
|---|---|---|
| committer | Christian Cleberg <hello@cleberg.net> | 2024-07-08 20:31:42 -0500 |
| commit | a807aed5c389d1dfadcd5c88b79c48469aa5b9d9 (patch) | |
| tree | 5291dff815cf5888992a18702bb1b7f5bb421d3a | |
| parent | ce89917716b1e9f76d49fd169c7b1feab0af6d72 (diff) | |
| download | cleberg.net-a807aed5c389d1dfadcd5c88b79c48469aa5b9d9.tar.gz cleberg.net-a807aed5c389d1dfadcd5c88b79c48469aa5b9d9.tar.bz2 cleberg.net-a807aed5c389d1dfadcd5c88b79c48469aa5b9d9.zip | |
fix images for 2023 and 2024 posts
| -rw-r--r-- | content/blog/2023-01-23-random-wireguard.md | 3 | ||||
| -rw-r--r-- | content/blog/2023-01-28-self-hosting-wger.md | 6 | ||||
| -rw-r--r-- | content/blog/2023-06-08-goaccess-geoip.md | 18 | ||||
| -rw-r--r-- | content/blog/2023-06-08-self-hosting-baikal.md | 3 | ||||
| -rw-r--r-- | content/blog/2023-06-18-unifi-ip-blocklist.md | 13 | ||||
| -rw-r--r-- | content/blog/2023-09-15-self-hosting-gitweb.md | 4 | ||||
| -rw-r--r-- | content/blog/2023-10-15-alpine-ssh-hardening.md | 6 | ||||
| -rw-r--r-- | content/blog/2024-01-27-tableau-dashboard.md | 15 | ||||
| -rw-r--r-- | content/blog/2024-05-03-ubuntu-on-macos.md | 3 |
9 files changed, 2 insertions, 69 deletions
diff --git a/content/blog/2023-01-23-random-wireguard.md b/content/blog/2023-01-23-random-wireguard.md index 6128254..7b9db68 100644 --- a/content/blog/2023-01-23-random-wireguard.md +++ b/content/blog/2023-01-23-random-wireguard.md @@ -82,9 +82,6 @@ You can also go to the [Connection Check \| Mullvad](https://mullvad.net/en/check/) page to see if you are fully connected to Mullvad and if any leaks exist. -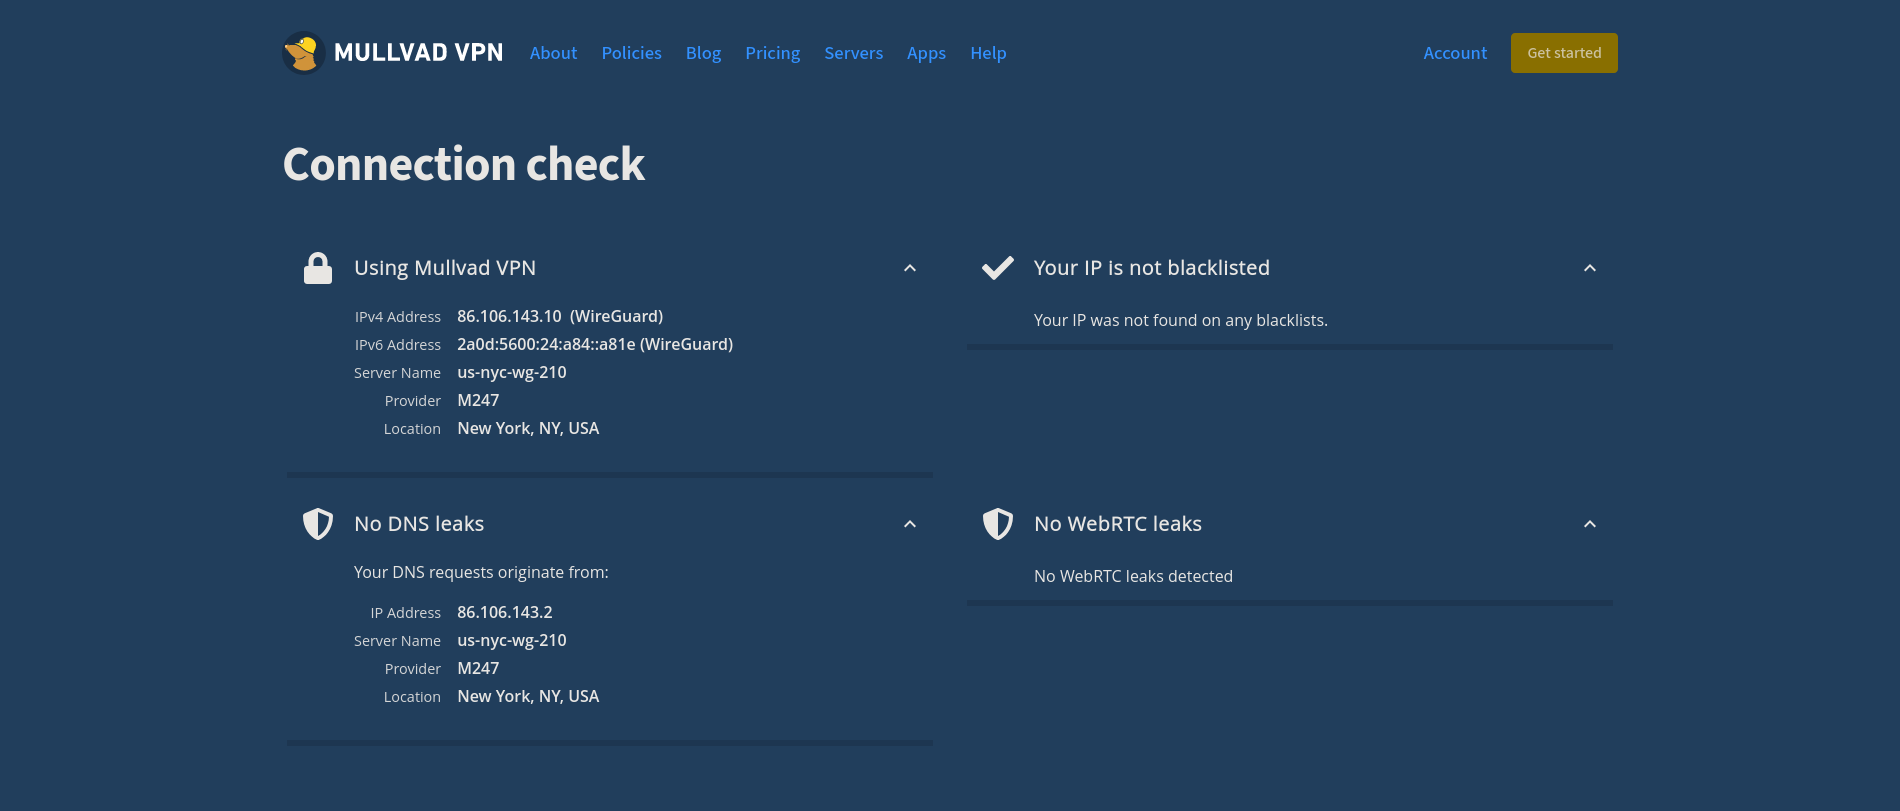 - # Disconnecting from the Wireguard Connection If you forget which connection you're using, you can execute the following diff --git a/content/blog/2023-01-28-self-hosting-wger.md b/content/blog/2023-01-28-self-hosting-wger.md index 6a7a04c..3f223a9 100644 --- a/content/blog/2023-01-28-self-hosting-wger.md +++ b/content/blog/2023-01-28-self-hosting-wger.md @@ -140,9 +140,3 @@ terms of reps and weight. I haven't tried the food log yet and I likely will not, at least for a while. I have no need for a food log or calorie tracker at the moment. - -## Screenshot Example - -You can see an example of a dashboard with placeholder data here: - -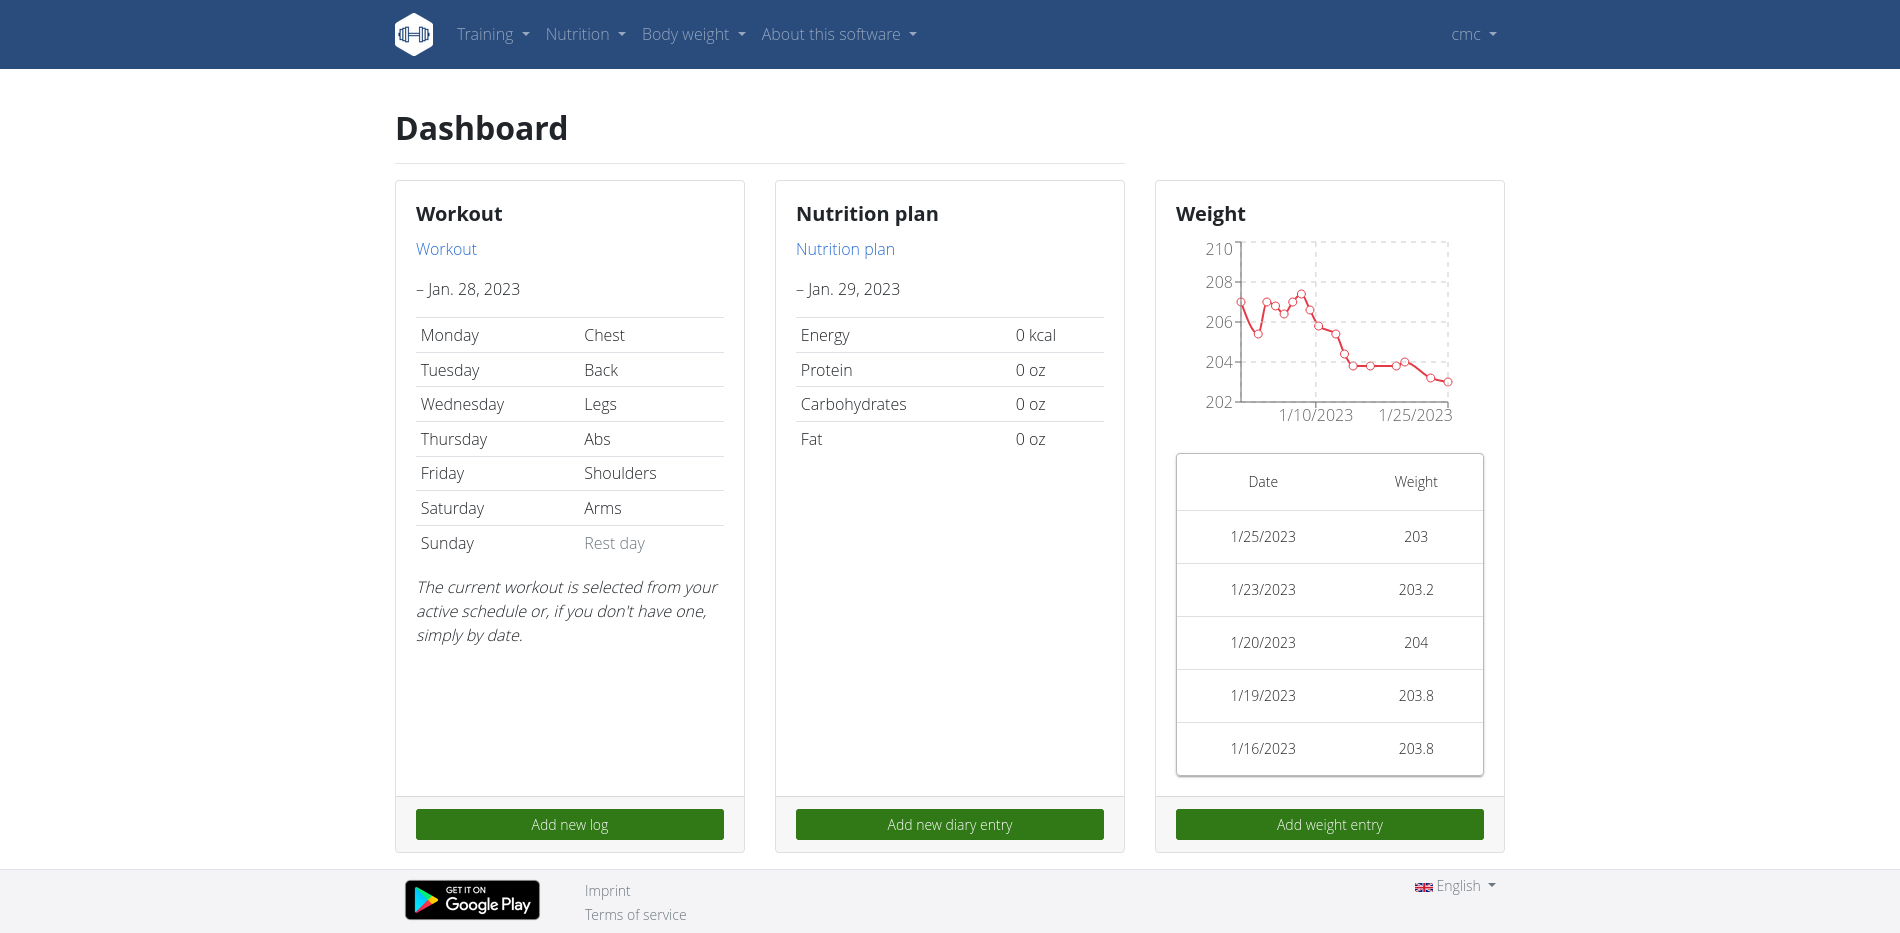 diff --git a/content/blog/2023-06-08-goaccess-geoip.md b/content/blog/2023-06-08-goaccess-geoip.md index b6cf33e..ff5d031 100644 --- a/content/blog/2023-06-08-goaccess-geoip.md +++ b/content/blog/2023-06-08-goaccess-geoip.md @@ -49,20 +49,4 @@ zcat /var/log/nginx/example.access.log.*.gz | goaccess \ --log-format=COMBINED \ -o output.html \ /var/log/nginx/example.access.log - -``` - -## Example Output - -See below for an example of the HTML output: - -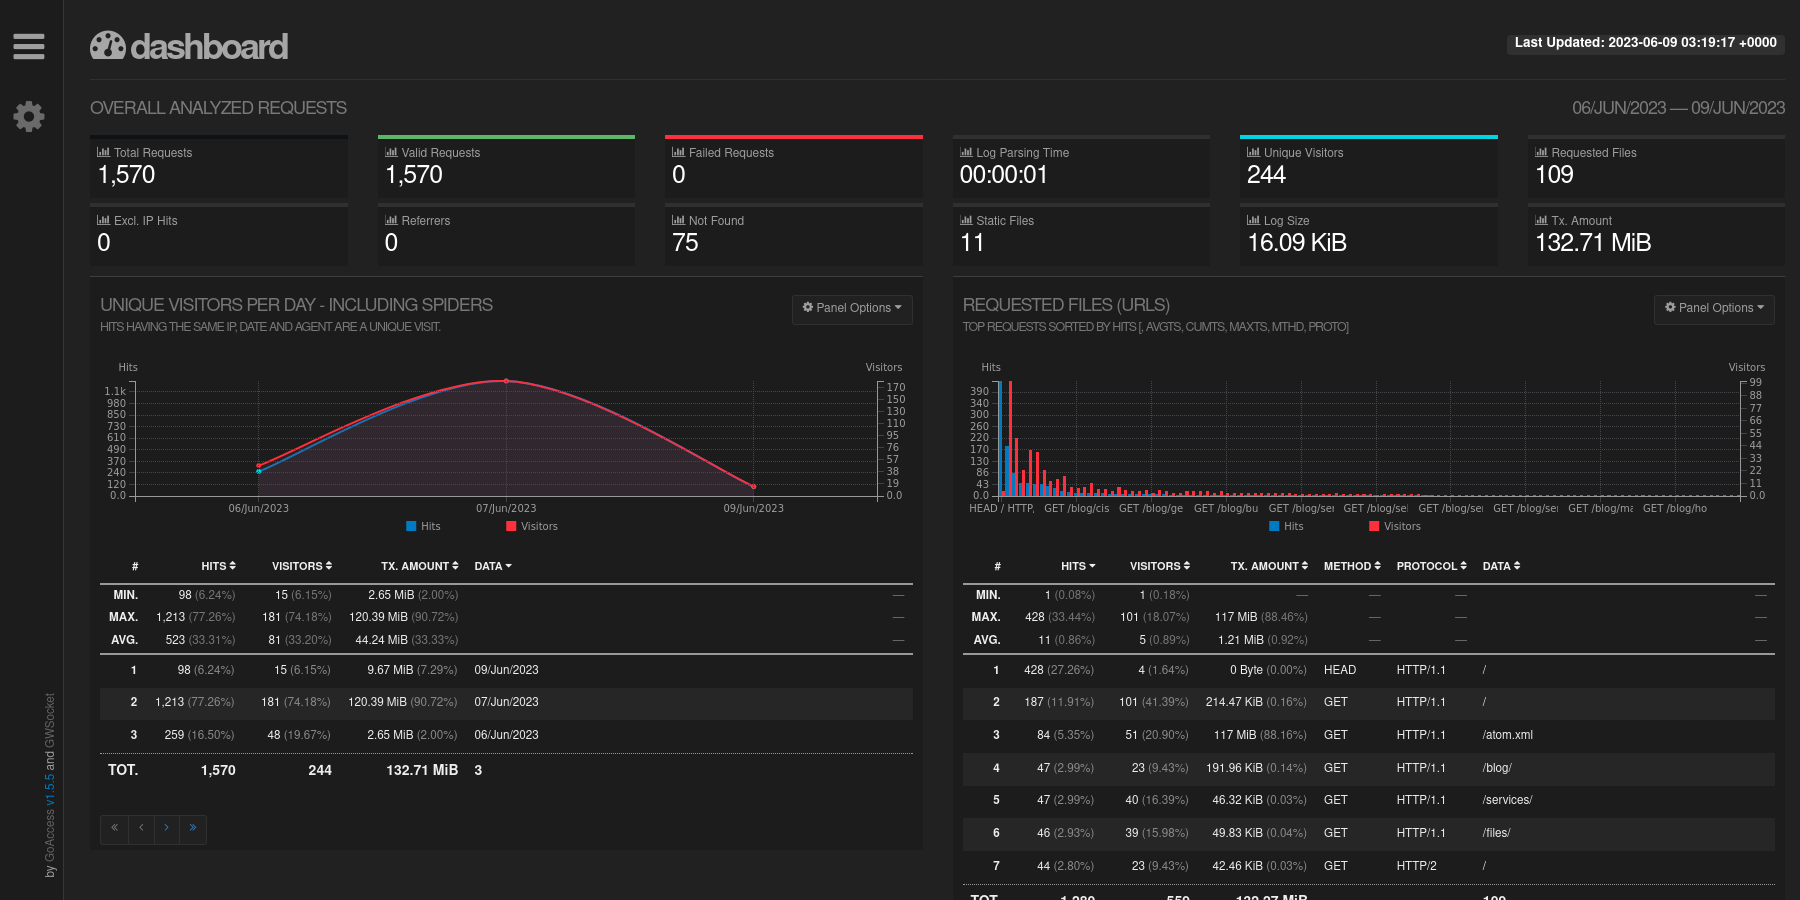 - -You can also see the GeoIP card created by the integration of the MaxMind -database information. - -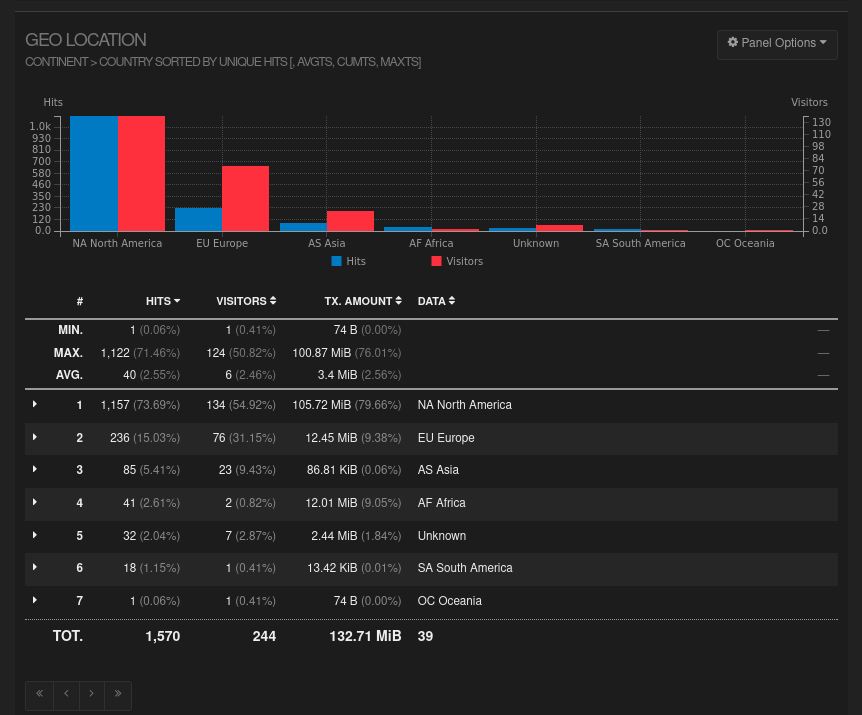 - -That's all there is to it! Informational data is provided in an organized -fashion with minimal effort. +```
\ No newline at end of file diff --git a/content/blog/2023-06-08-self-hosting-baikal.md b/content/blog/2023-06-08-self-hosting-baikal.md index c53da2b..fd426d3 100644 --- a/content/blog/2023-06-08-self-hosting-baikal.md +++ b/content/blog/2023-06-08-self-hosting-baikal.md @@ -65,9 +65,6 @@ which will show the version of the app, status of the admin/CalDAV/CardDAV services, and the number of users, calendars, events, address books, and contacts. -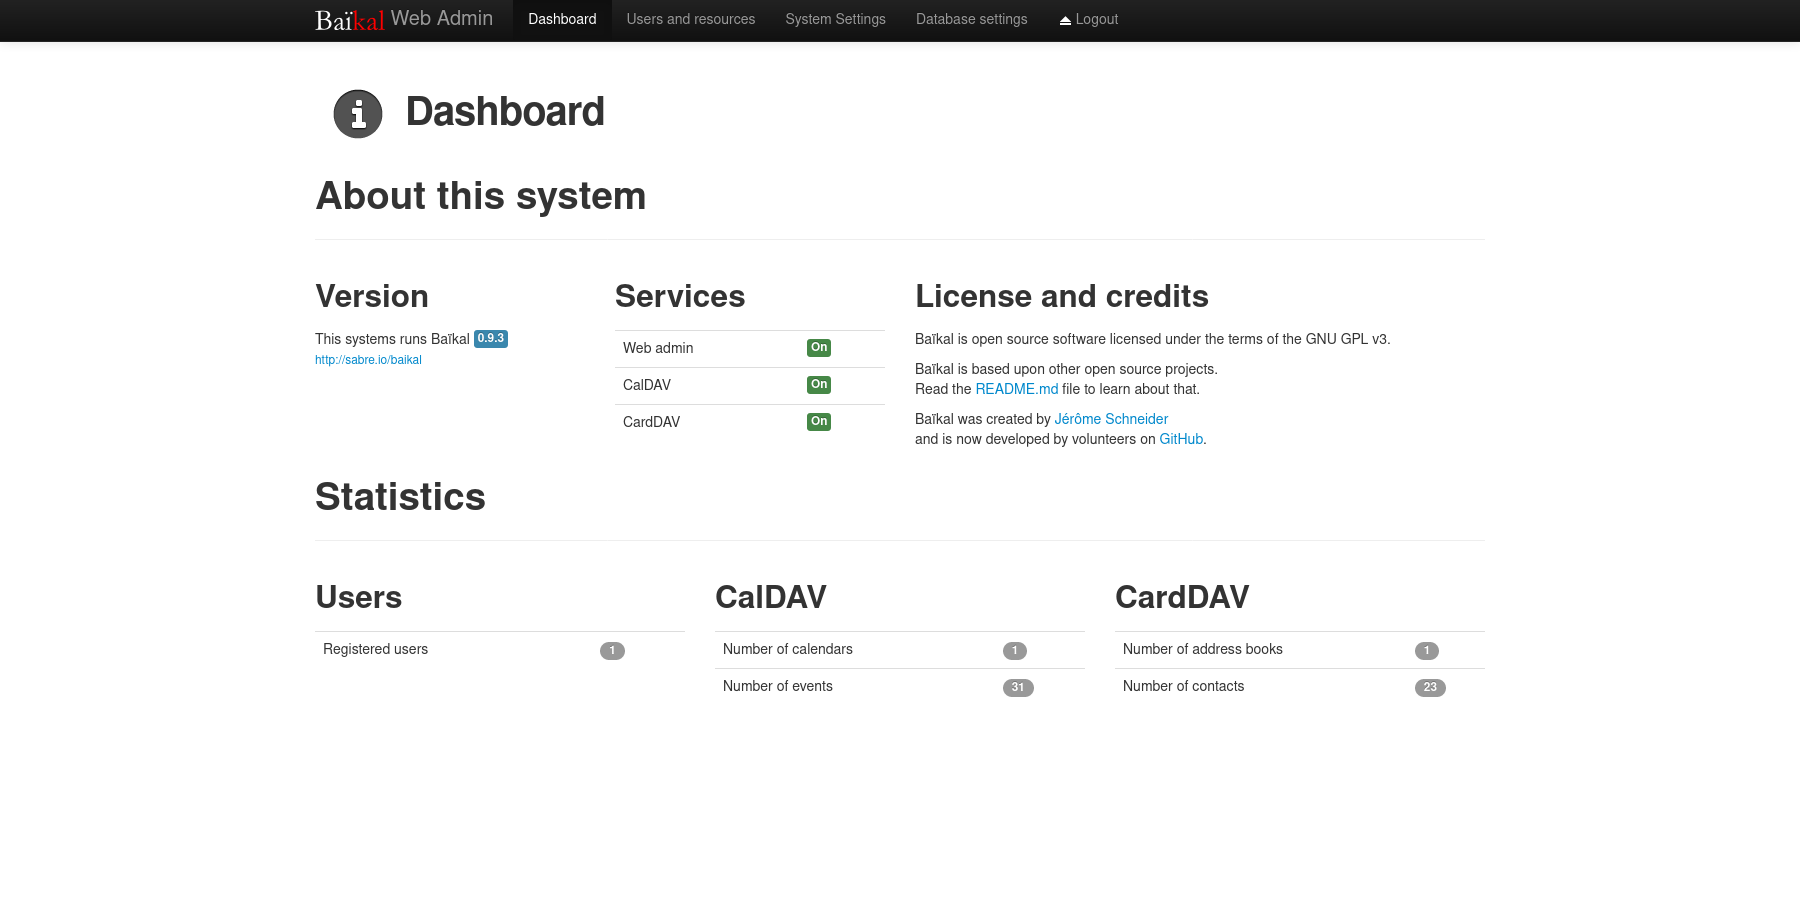 - To create a new user, navigate to the `Users and resources` page. This process is as simple as entering a username, password, and email. diff --git a/content/blog/2023-06-18-unifi-ip-blocklist.md b/content/blog/2023-06-18-unifi-ip-blocklist.md index 9e8a860..5861054 100644 --- a/content/blog/2023-06-18-unifi-ip-blocklist.md +++ b/content/blog/2023-06-18-unifi-ip-blocklist.md @@ -27,15 +27,10 @@ blocked yet. # Create an IP Group Profile -To start, login to the Unifi machine's web GUI and navigate to the Network app - -> Settings > Profiles. +To start, login to the Unifi machine's web GUI and navigate to the Network app > Settings > Profiles. Within this page, choose the `IP Groups` tab and click `Create New`. -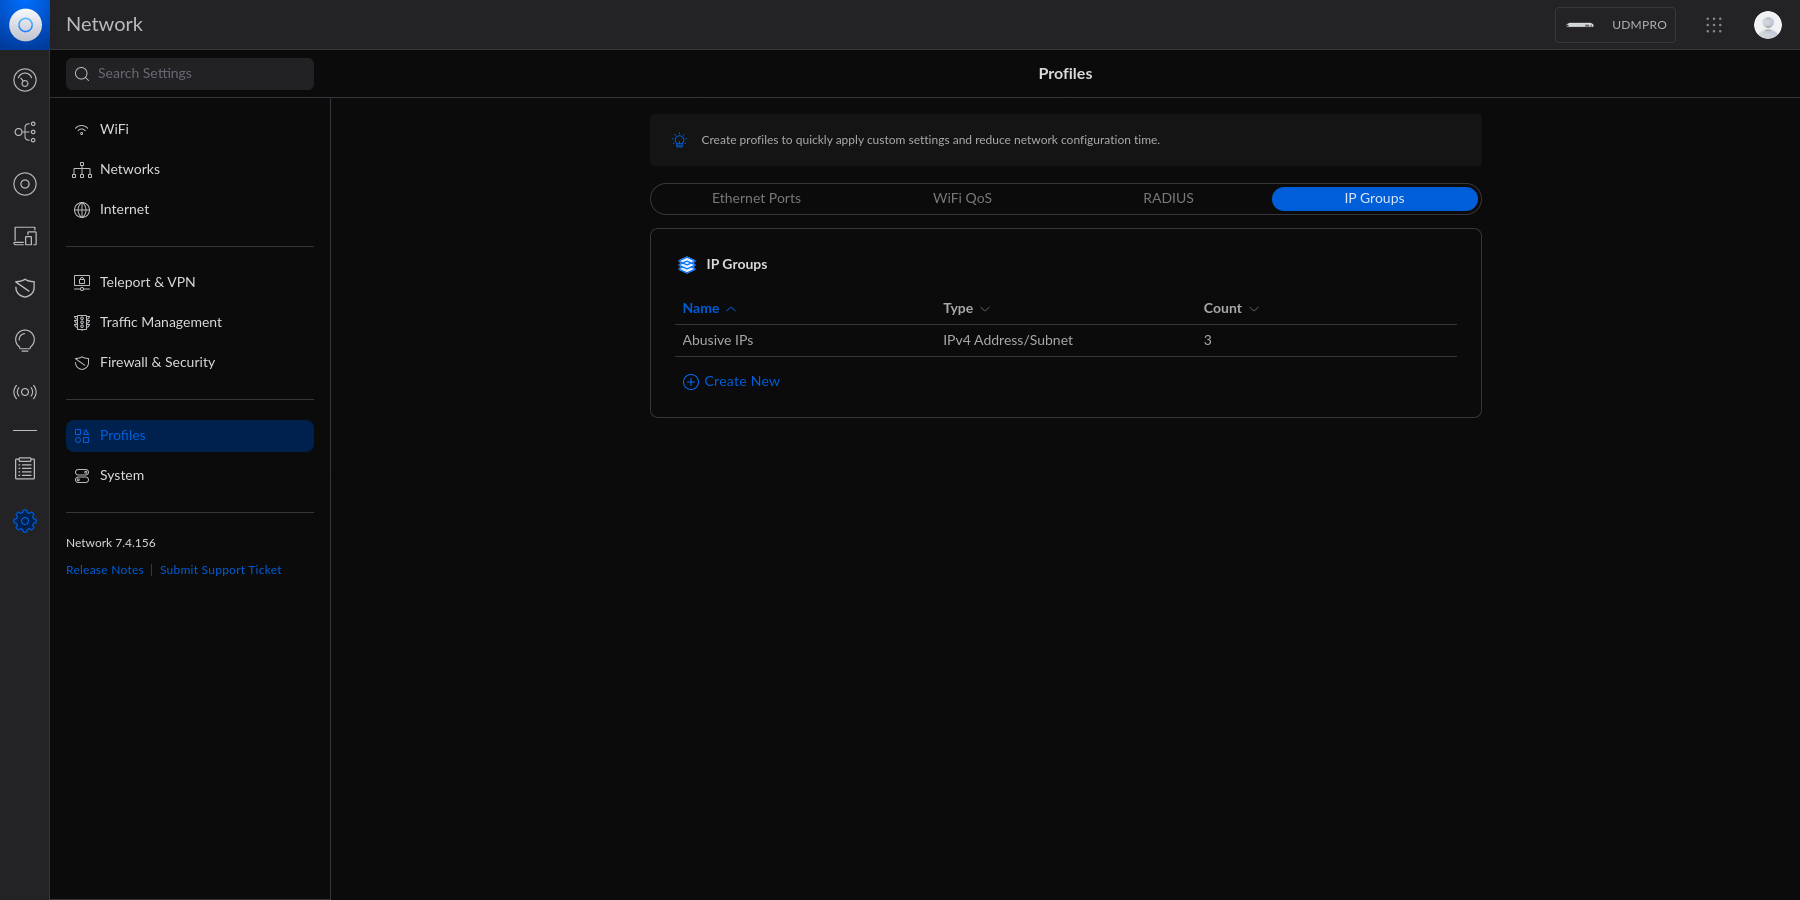 - Each IP Group profile can be used as one of three options: 1. Port Group @@ -46,9 +41,6 @@ In this example, I'm creating an IPv4 Address/Subnet group and adding a few different IP addresses and a subnet. Once you've added all IP addresses and subnets, click the `Apply` button that should appear at the bottom. -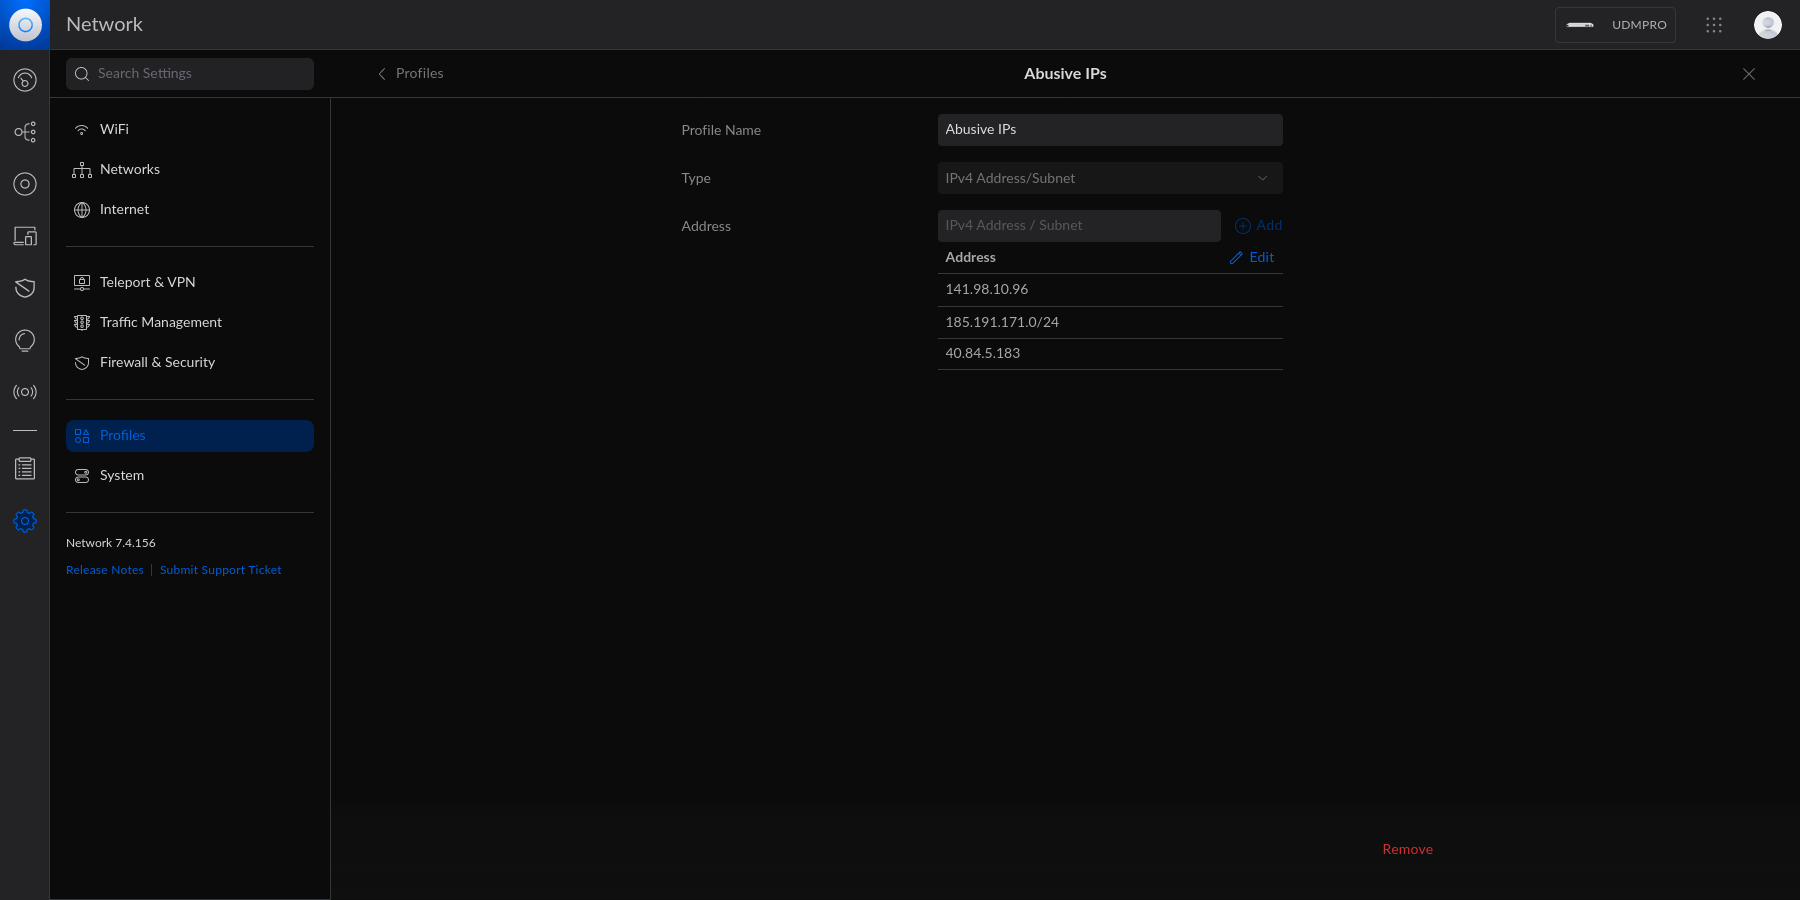 - At this point, the IPv4 Address/Subnet has been created but not yet used. # Drop IP Group Profile via the Unifi Firewall @@ -69,9 +61,6 @@ entry should contain the following settings: Customize the remaining configurations to your liking, and then save and enable the firewall rule. -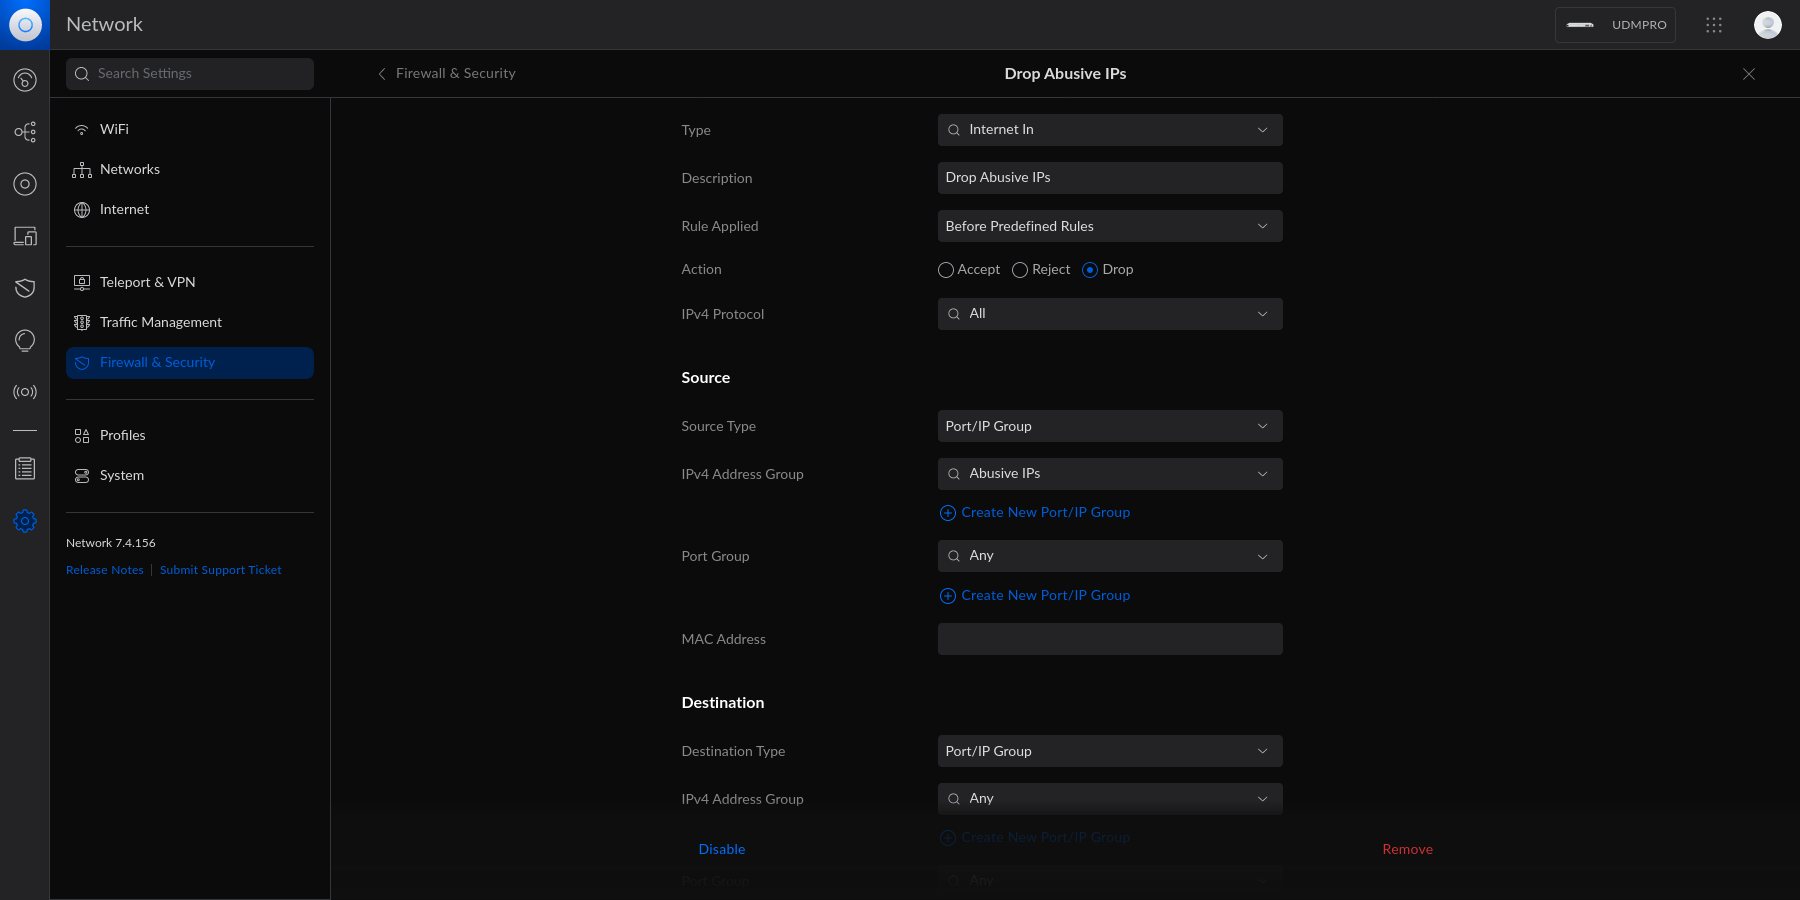 - Once enabled, the Unifi machine will be able to drop all incoming connections from the defined IP addresses and subnets within the created profile. diff --git a/content/blog/2023-09-15-self-hosting-gitweb.md b/content/blog/2023-09-15-self-hosting-gitweb.md index d687dcb..d91547d 100644 --- a/content/blog/2023-09-15-self-hosting-gitweb.md +++ b/content/blog/2023-09-15-self-hosting-gitweb.md @@ -14,10 +14,6 @@ the `lighttpd` or `webrick` web servers. However, this guide will show you how to keep GitWeb running in the background and display information for all repositories in a chosen directory. -See below for the final result: - -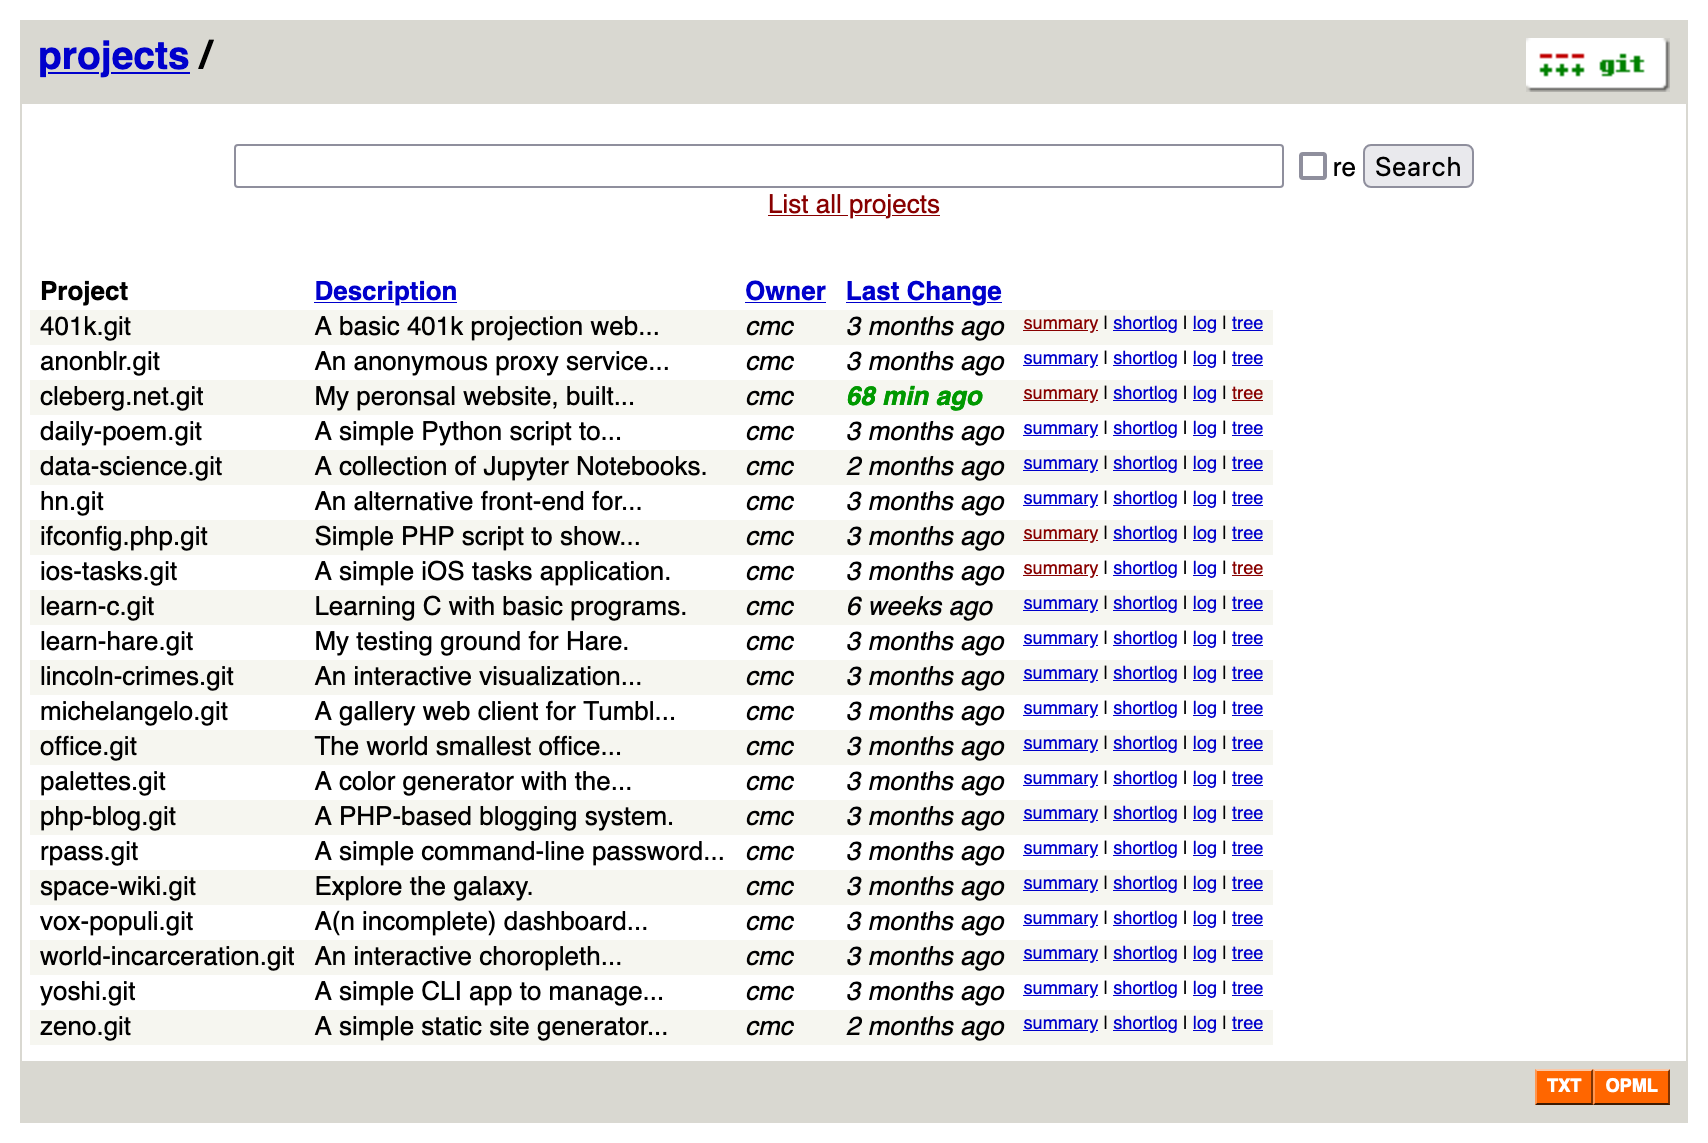 - # Install Dependencies To start, you'll need install the following packages: diff --git a/content/blog/2023-10-15-alpine-ssh-hardening.md b/content/blog/2023-10-15-alpine-ssh-hardening.md index bb7e71b..e3faf64 100644 --- a/content/blog/2023-10-15-alpine-ssh-hardening.md +++ b/content/blog/2023-10-15-alpine-ssh-hardening.md @@ -67,9 +67,3 @@ ssh-audit localhost If everything succeeded, the results will show as all green. If anything is yellow, orange, or red, you may need to tweak additional settings. - -```txt -#+caption: ssh audit -``` - -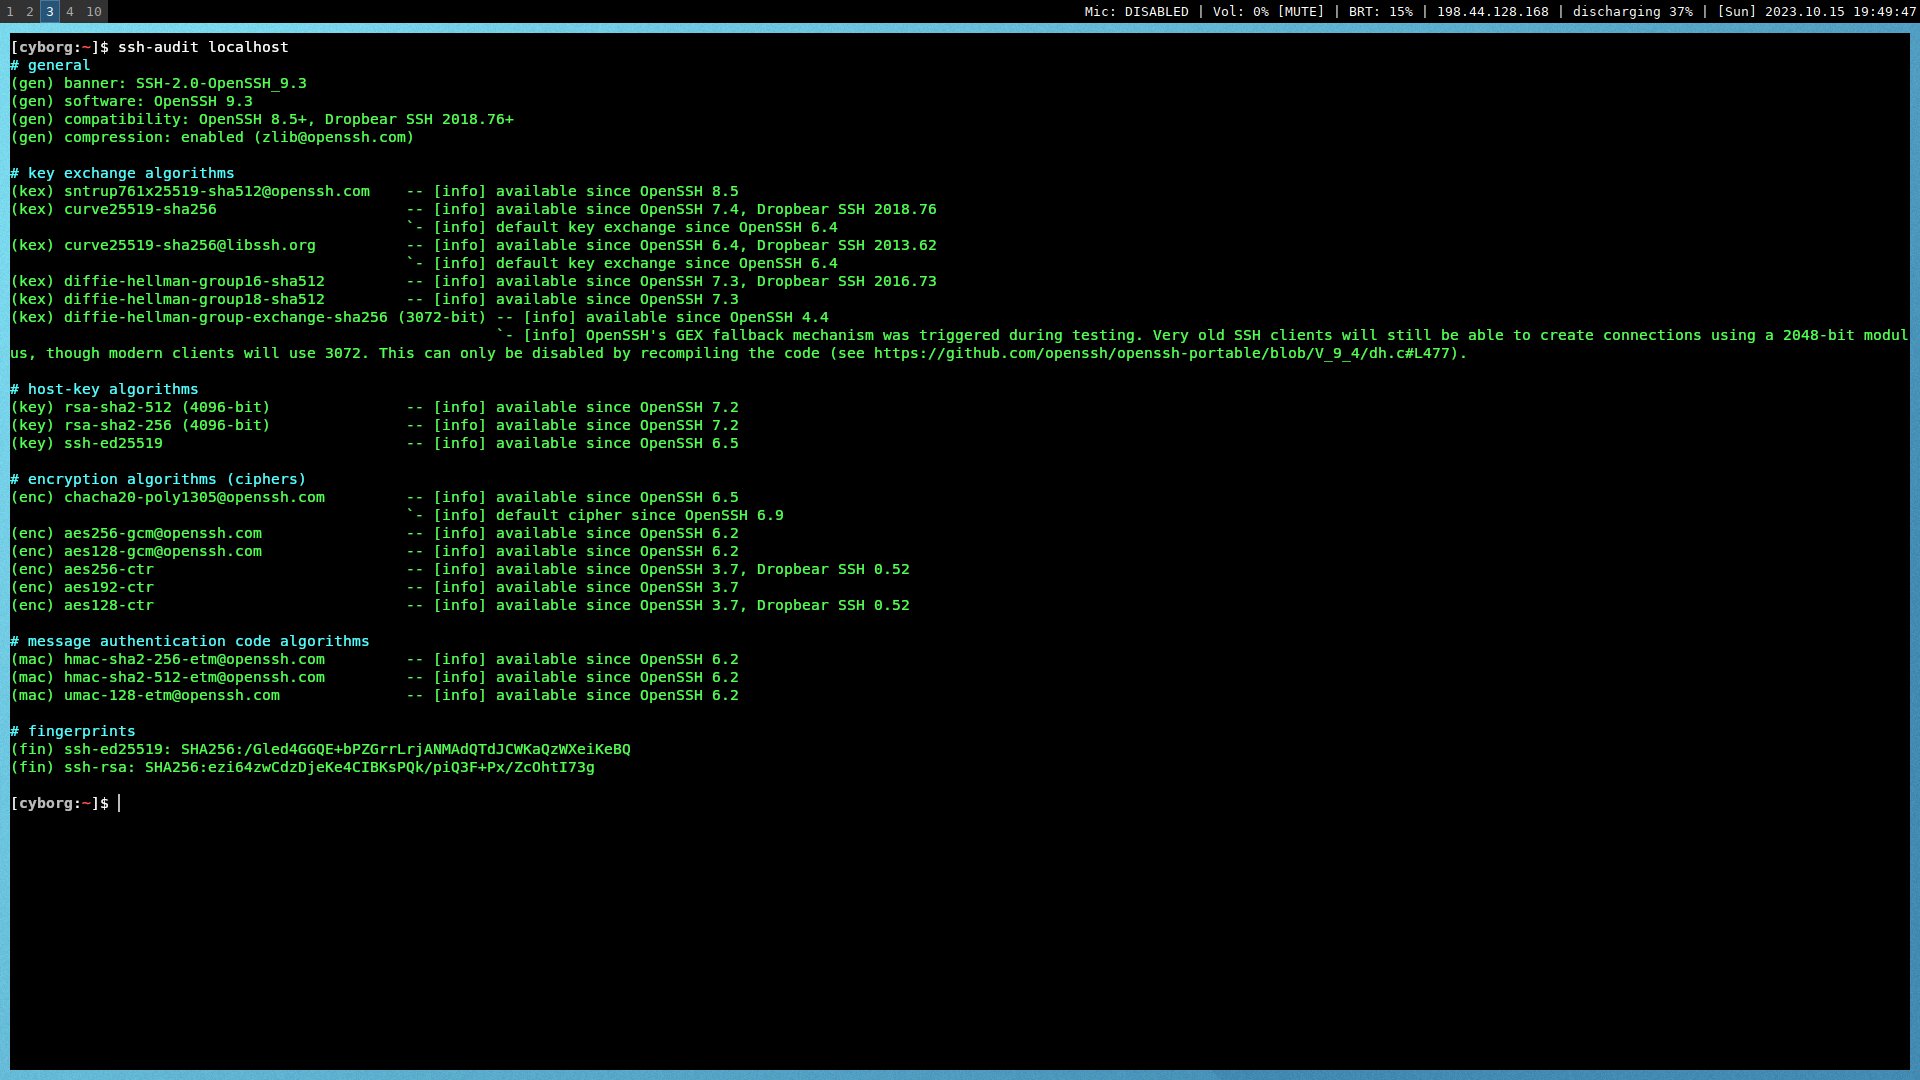 diff --git a/content/blog/2024-01-27-tableau-dashboard.md b/content/blog/2024-01-27-tableau-dashboard.md index 2f1e73d..3fa0d50 100644 --- a/content/blog/2024-01-27-tableau-dashboard.md +++ b/content/blog/2024-01-27-tableau-dashboard.md @@ -90,24 +90,15 @@ anything private. After creating an account, you can click the `Create` > `Web Authoring` link to create your first visualization. -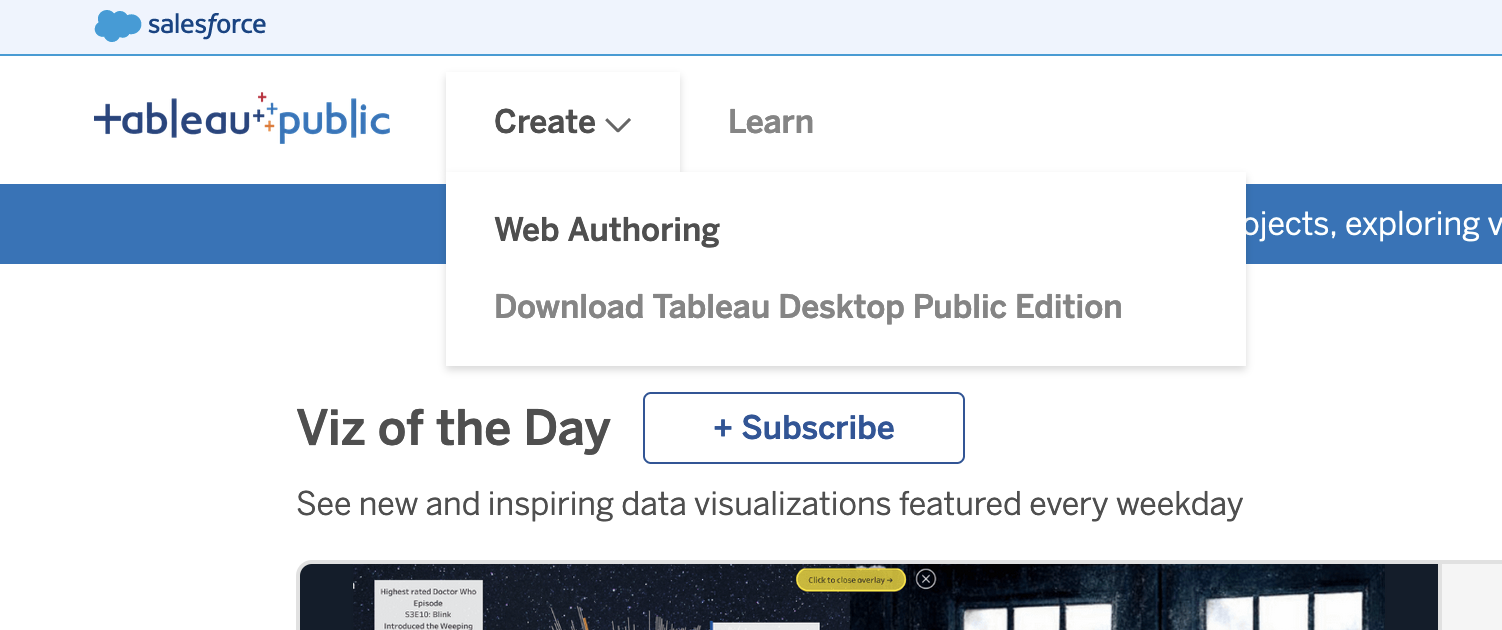 - ## Upload the Data Once you've opened your first project, Tableau will ask you to connect to your data. For this project, click the `Upload from computer` button and select the CSV file previously combined in the step above. -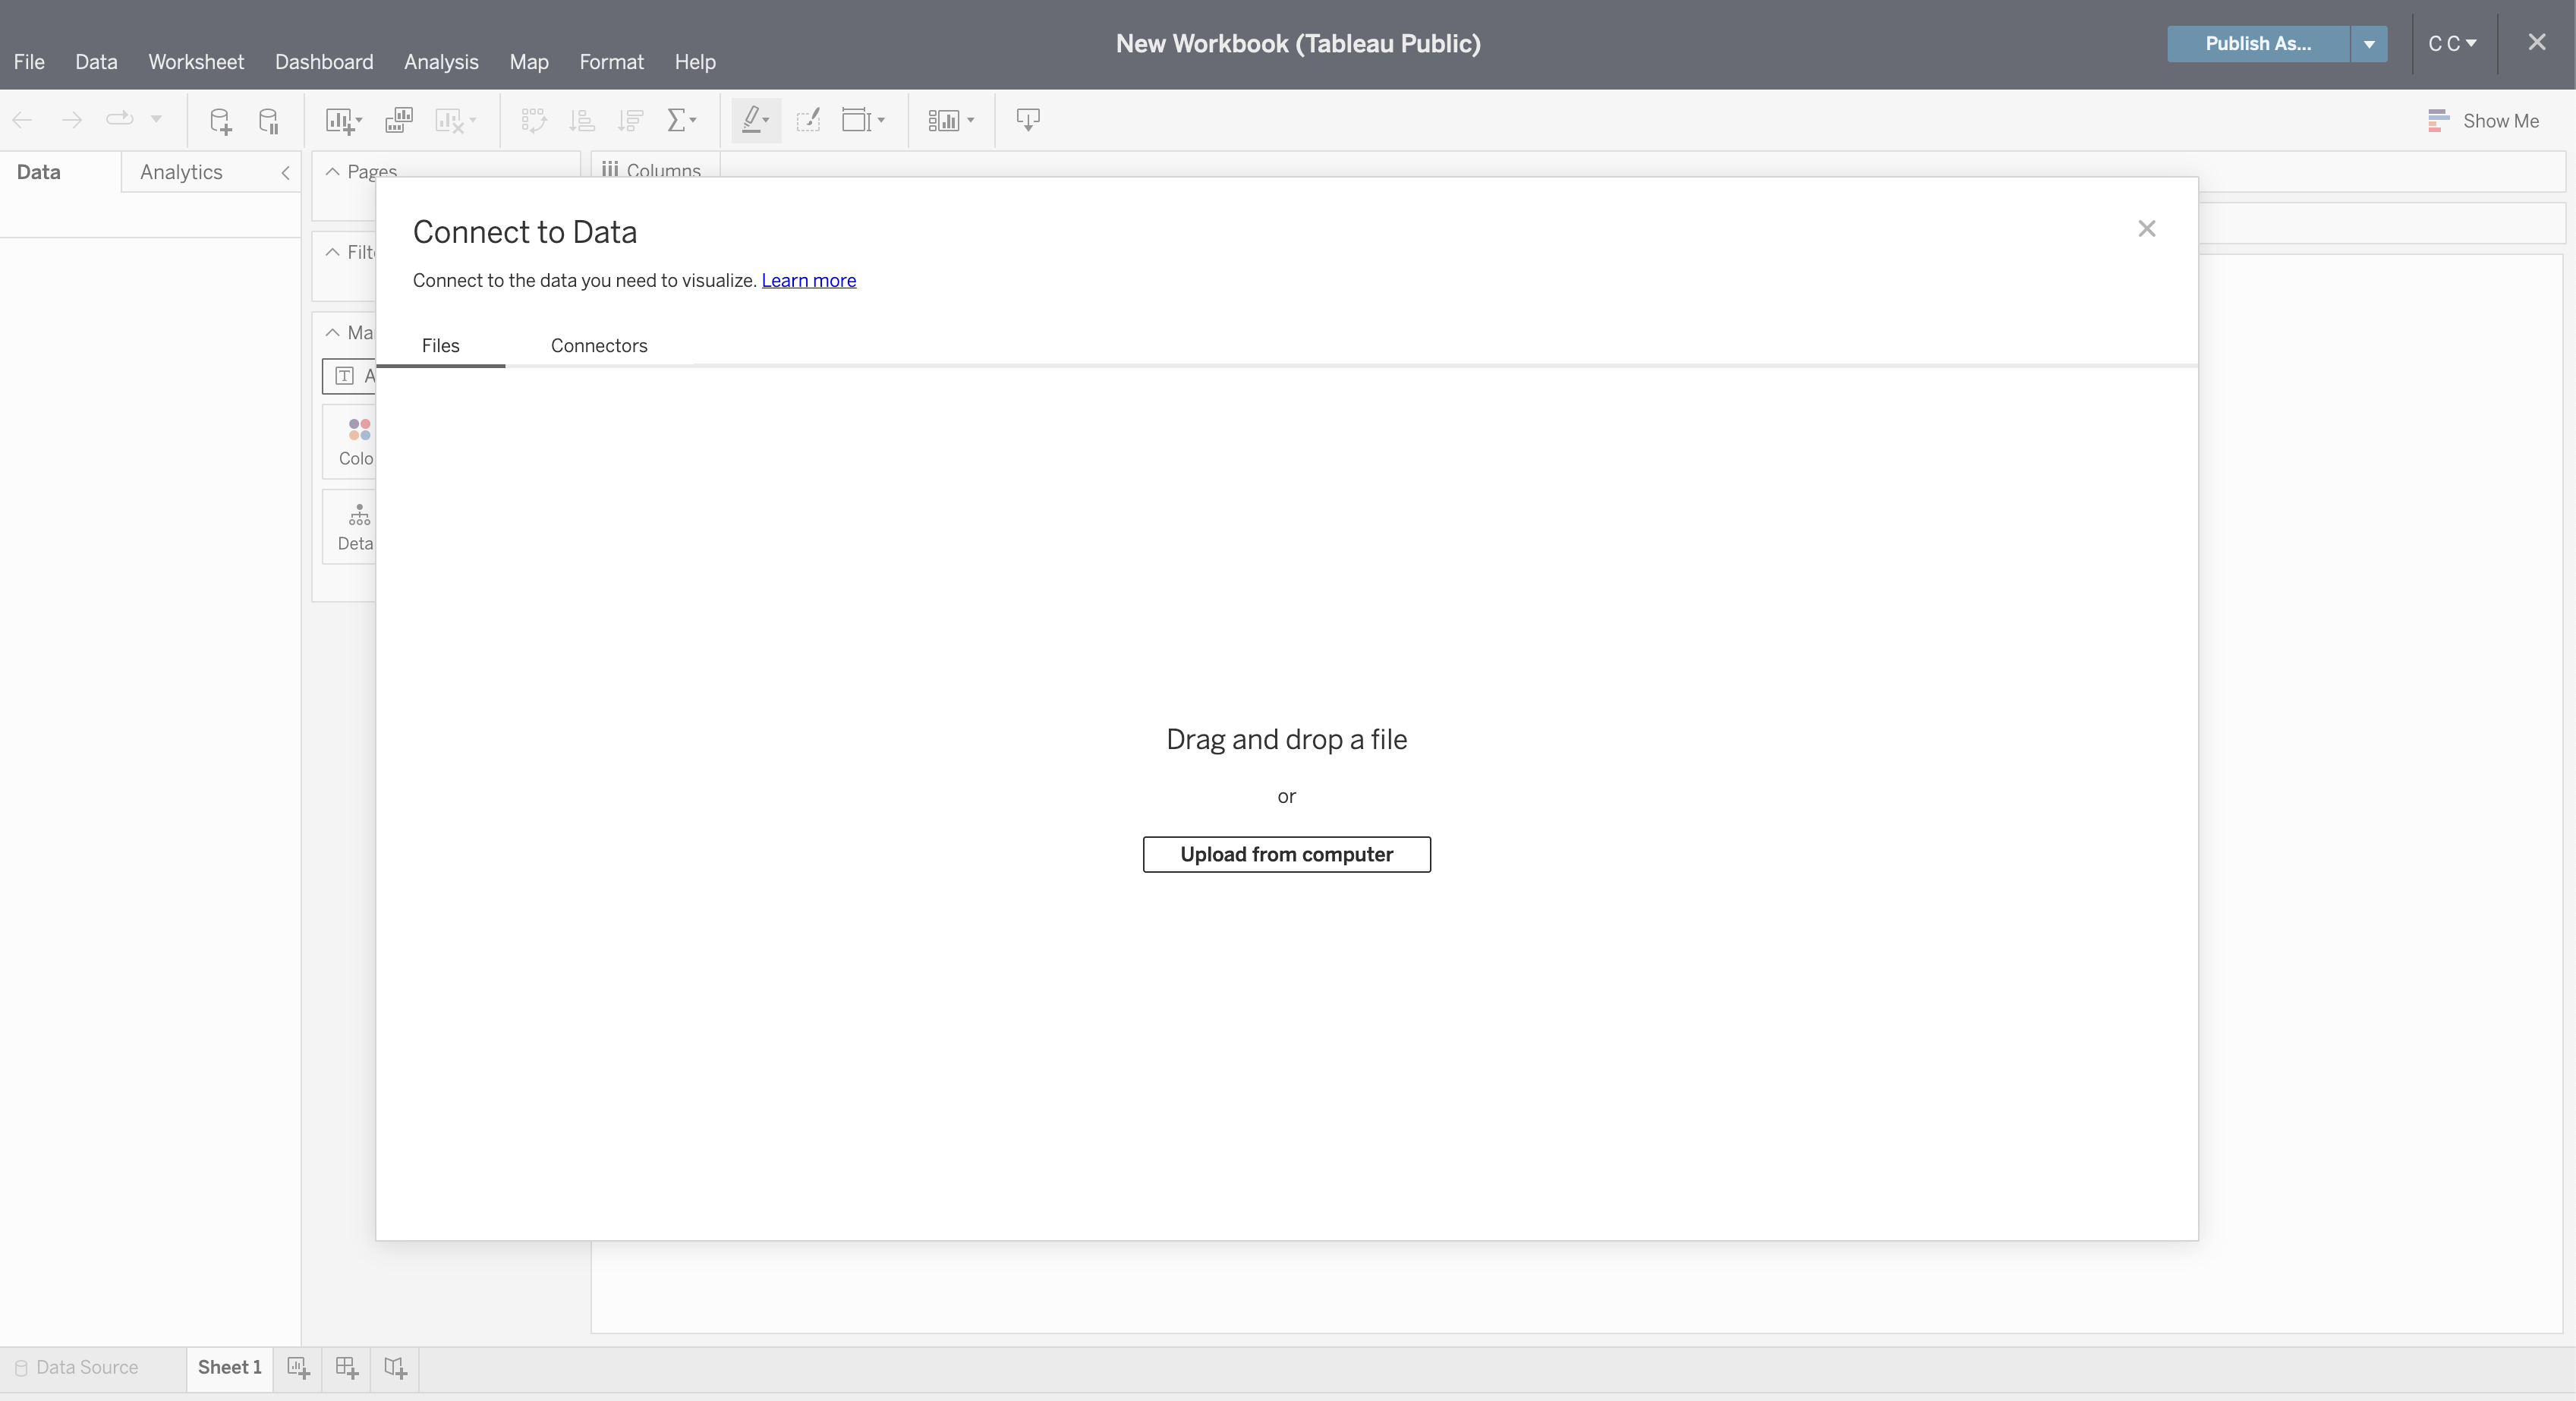 - Once connected, you can refresh the preview of the data with the `Refresh Data Source` button in the toolbar. -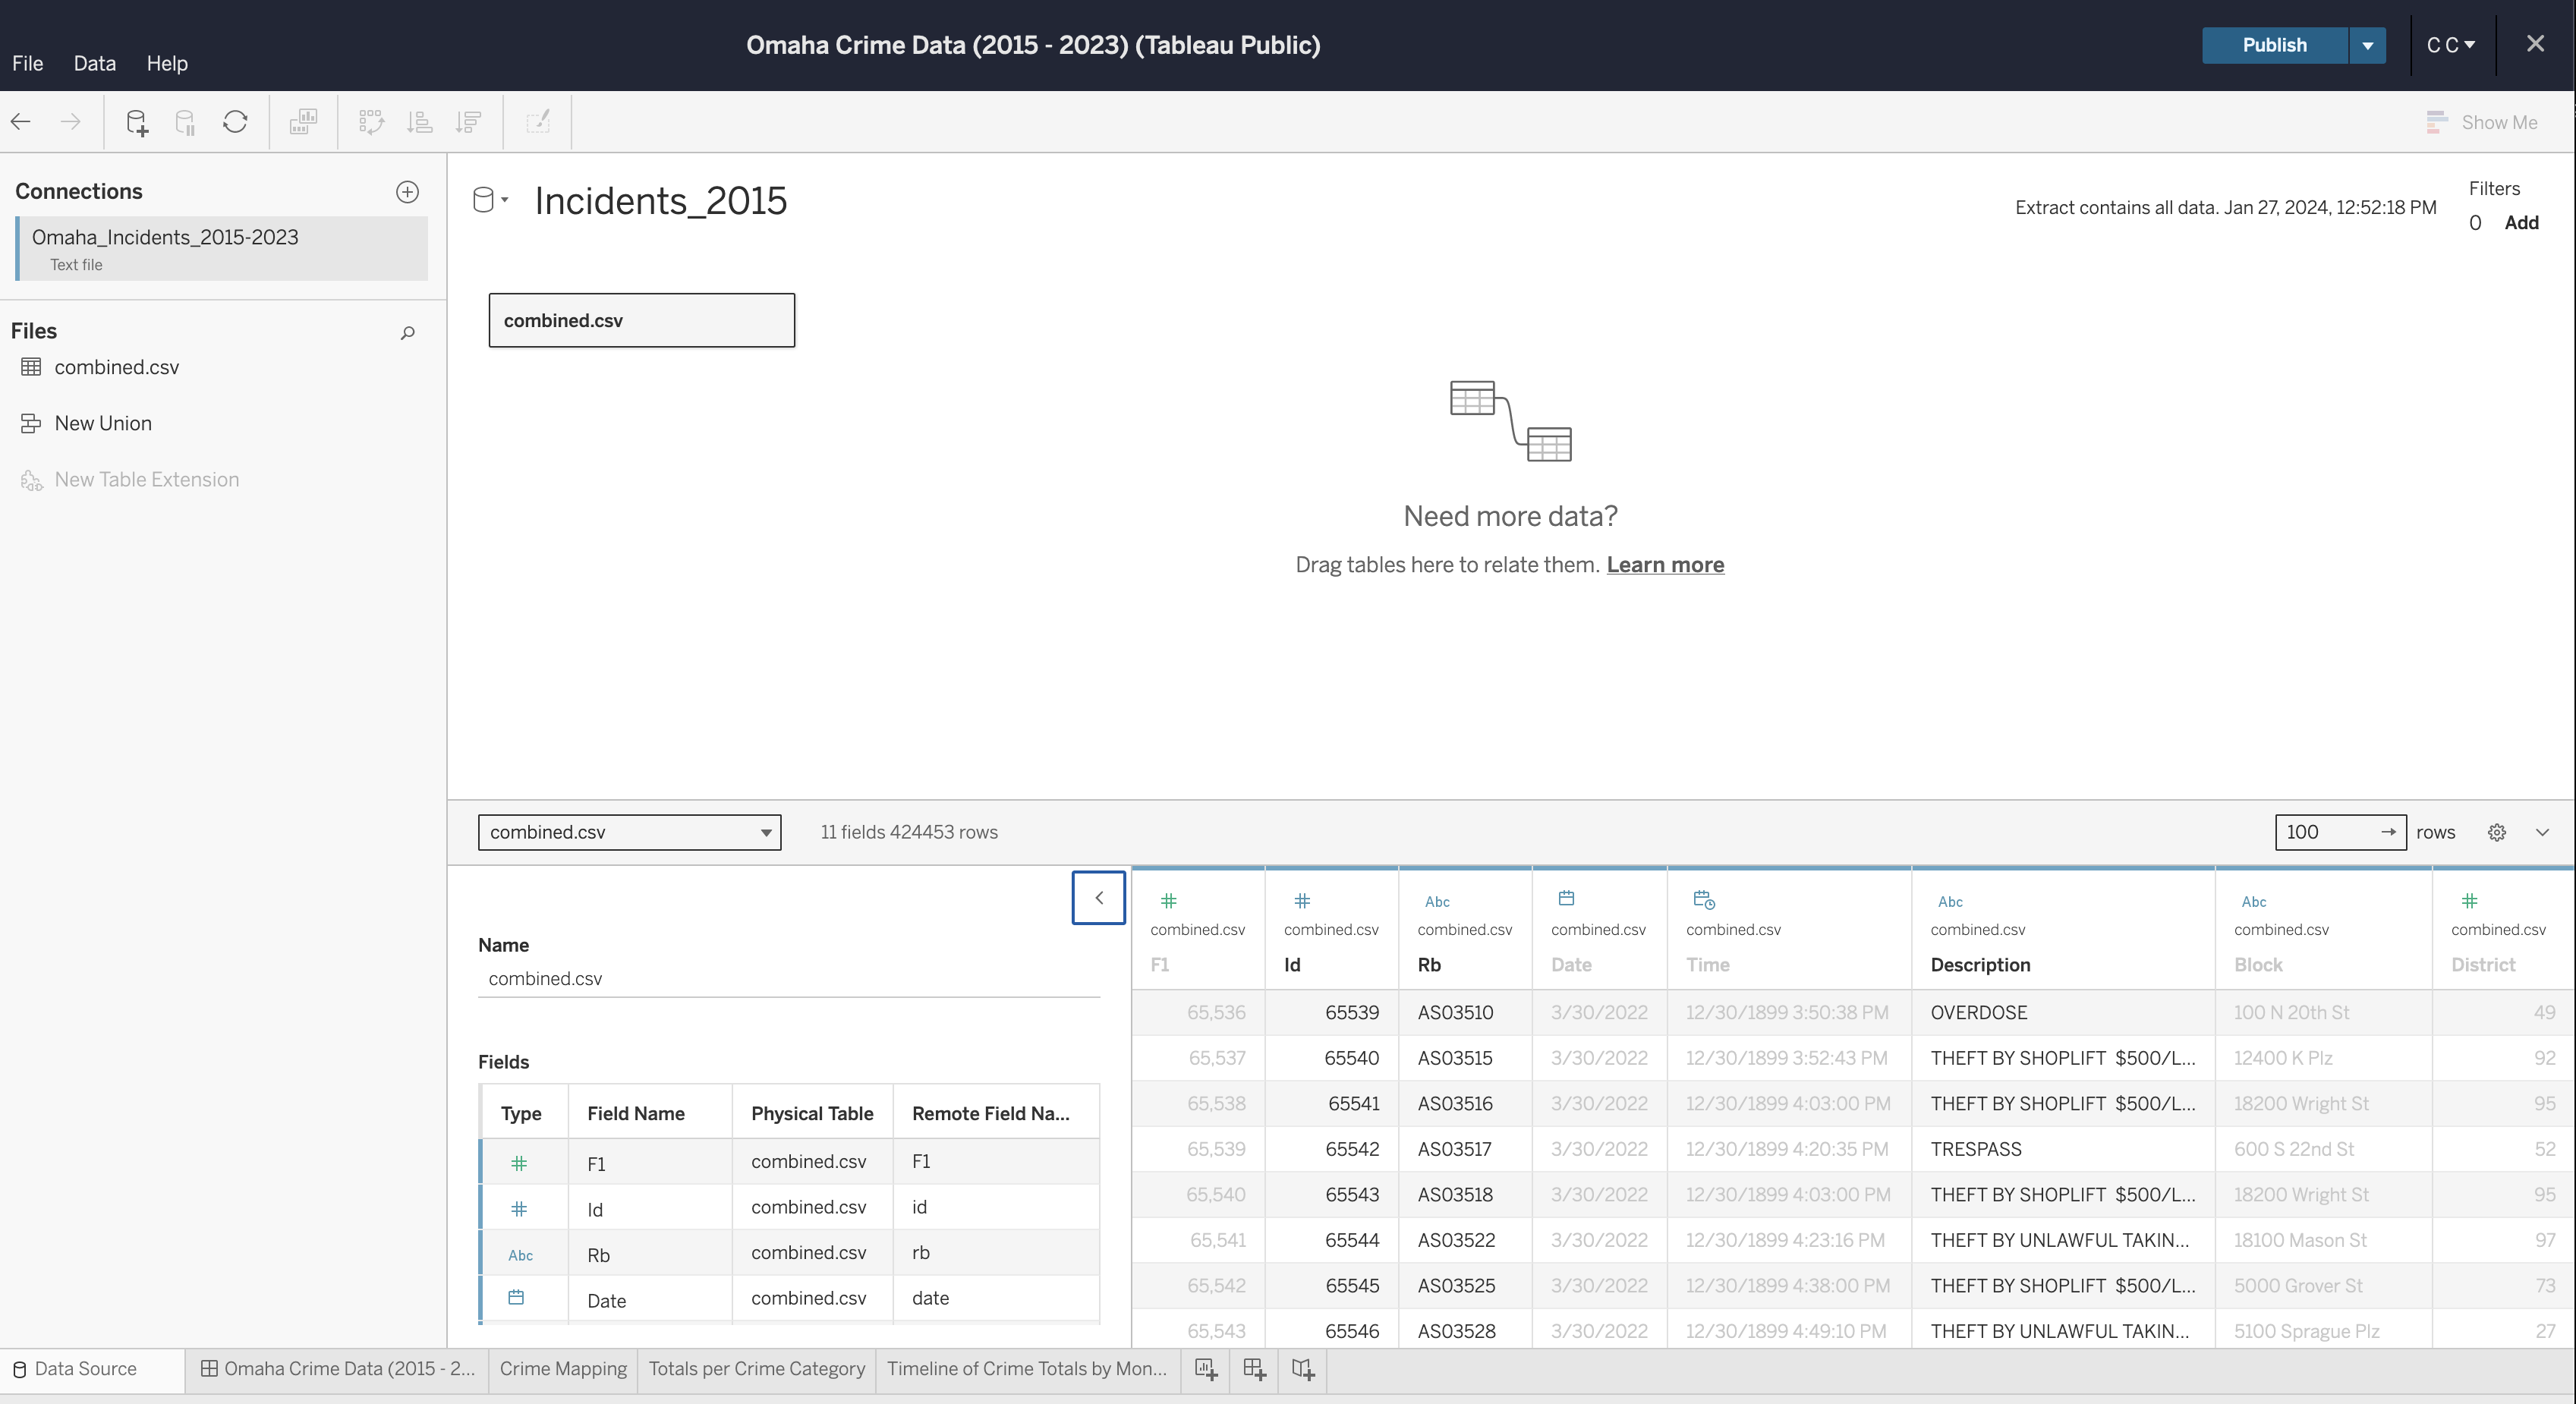 - If you need to edit any of the data types, column names, etc., you can do so now. Once complete, generate an extract so that you can start creating visualizations. @@ -129,9 +120,6 @@ following fields: - Datetime - `Filters`: Datetime -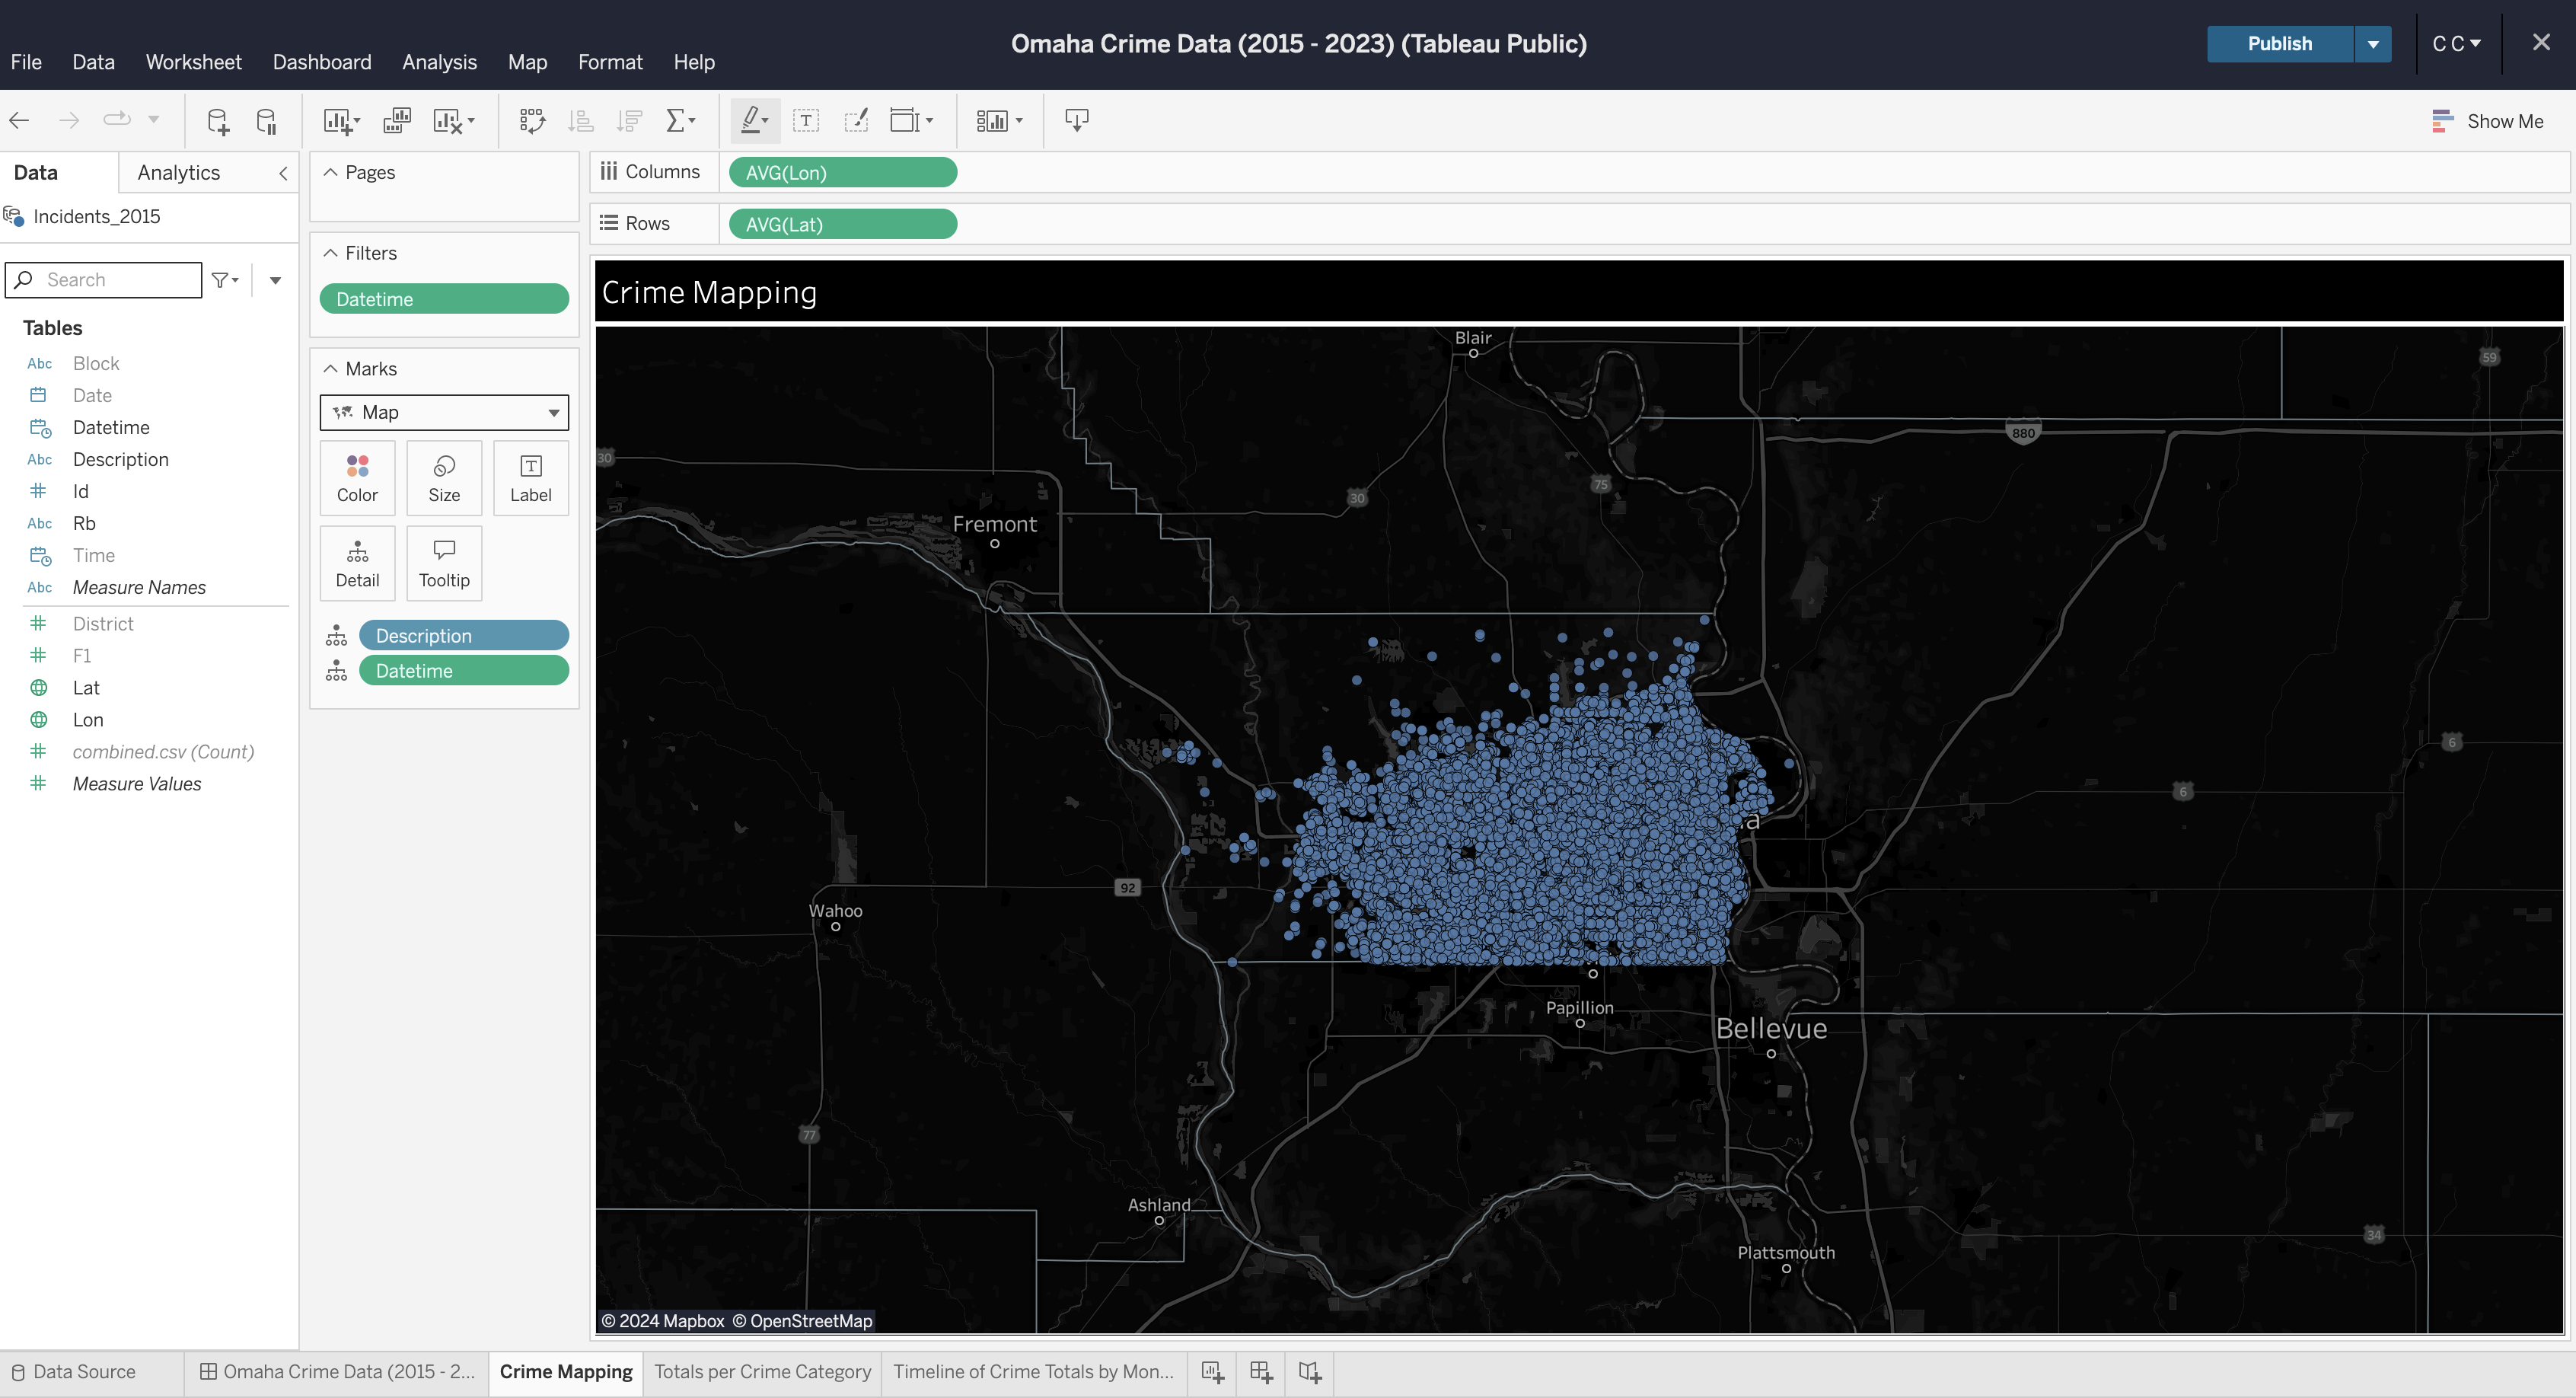 - You can repeat this process for each visualization you want to create. Explore your options by dragging data fields to different areas and by opening the field options to explore what operations can be performed on different data types @@ -143,9 +131,6 @@ To create a dashboard, click the button on the toolbar at the bottom of the screen. Within the dashboard, drag each sheet from the left side bar onto the dashboard canvas. -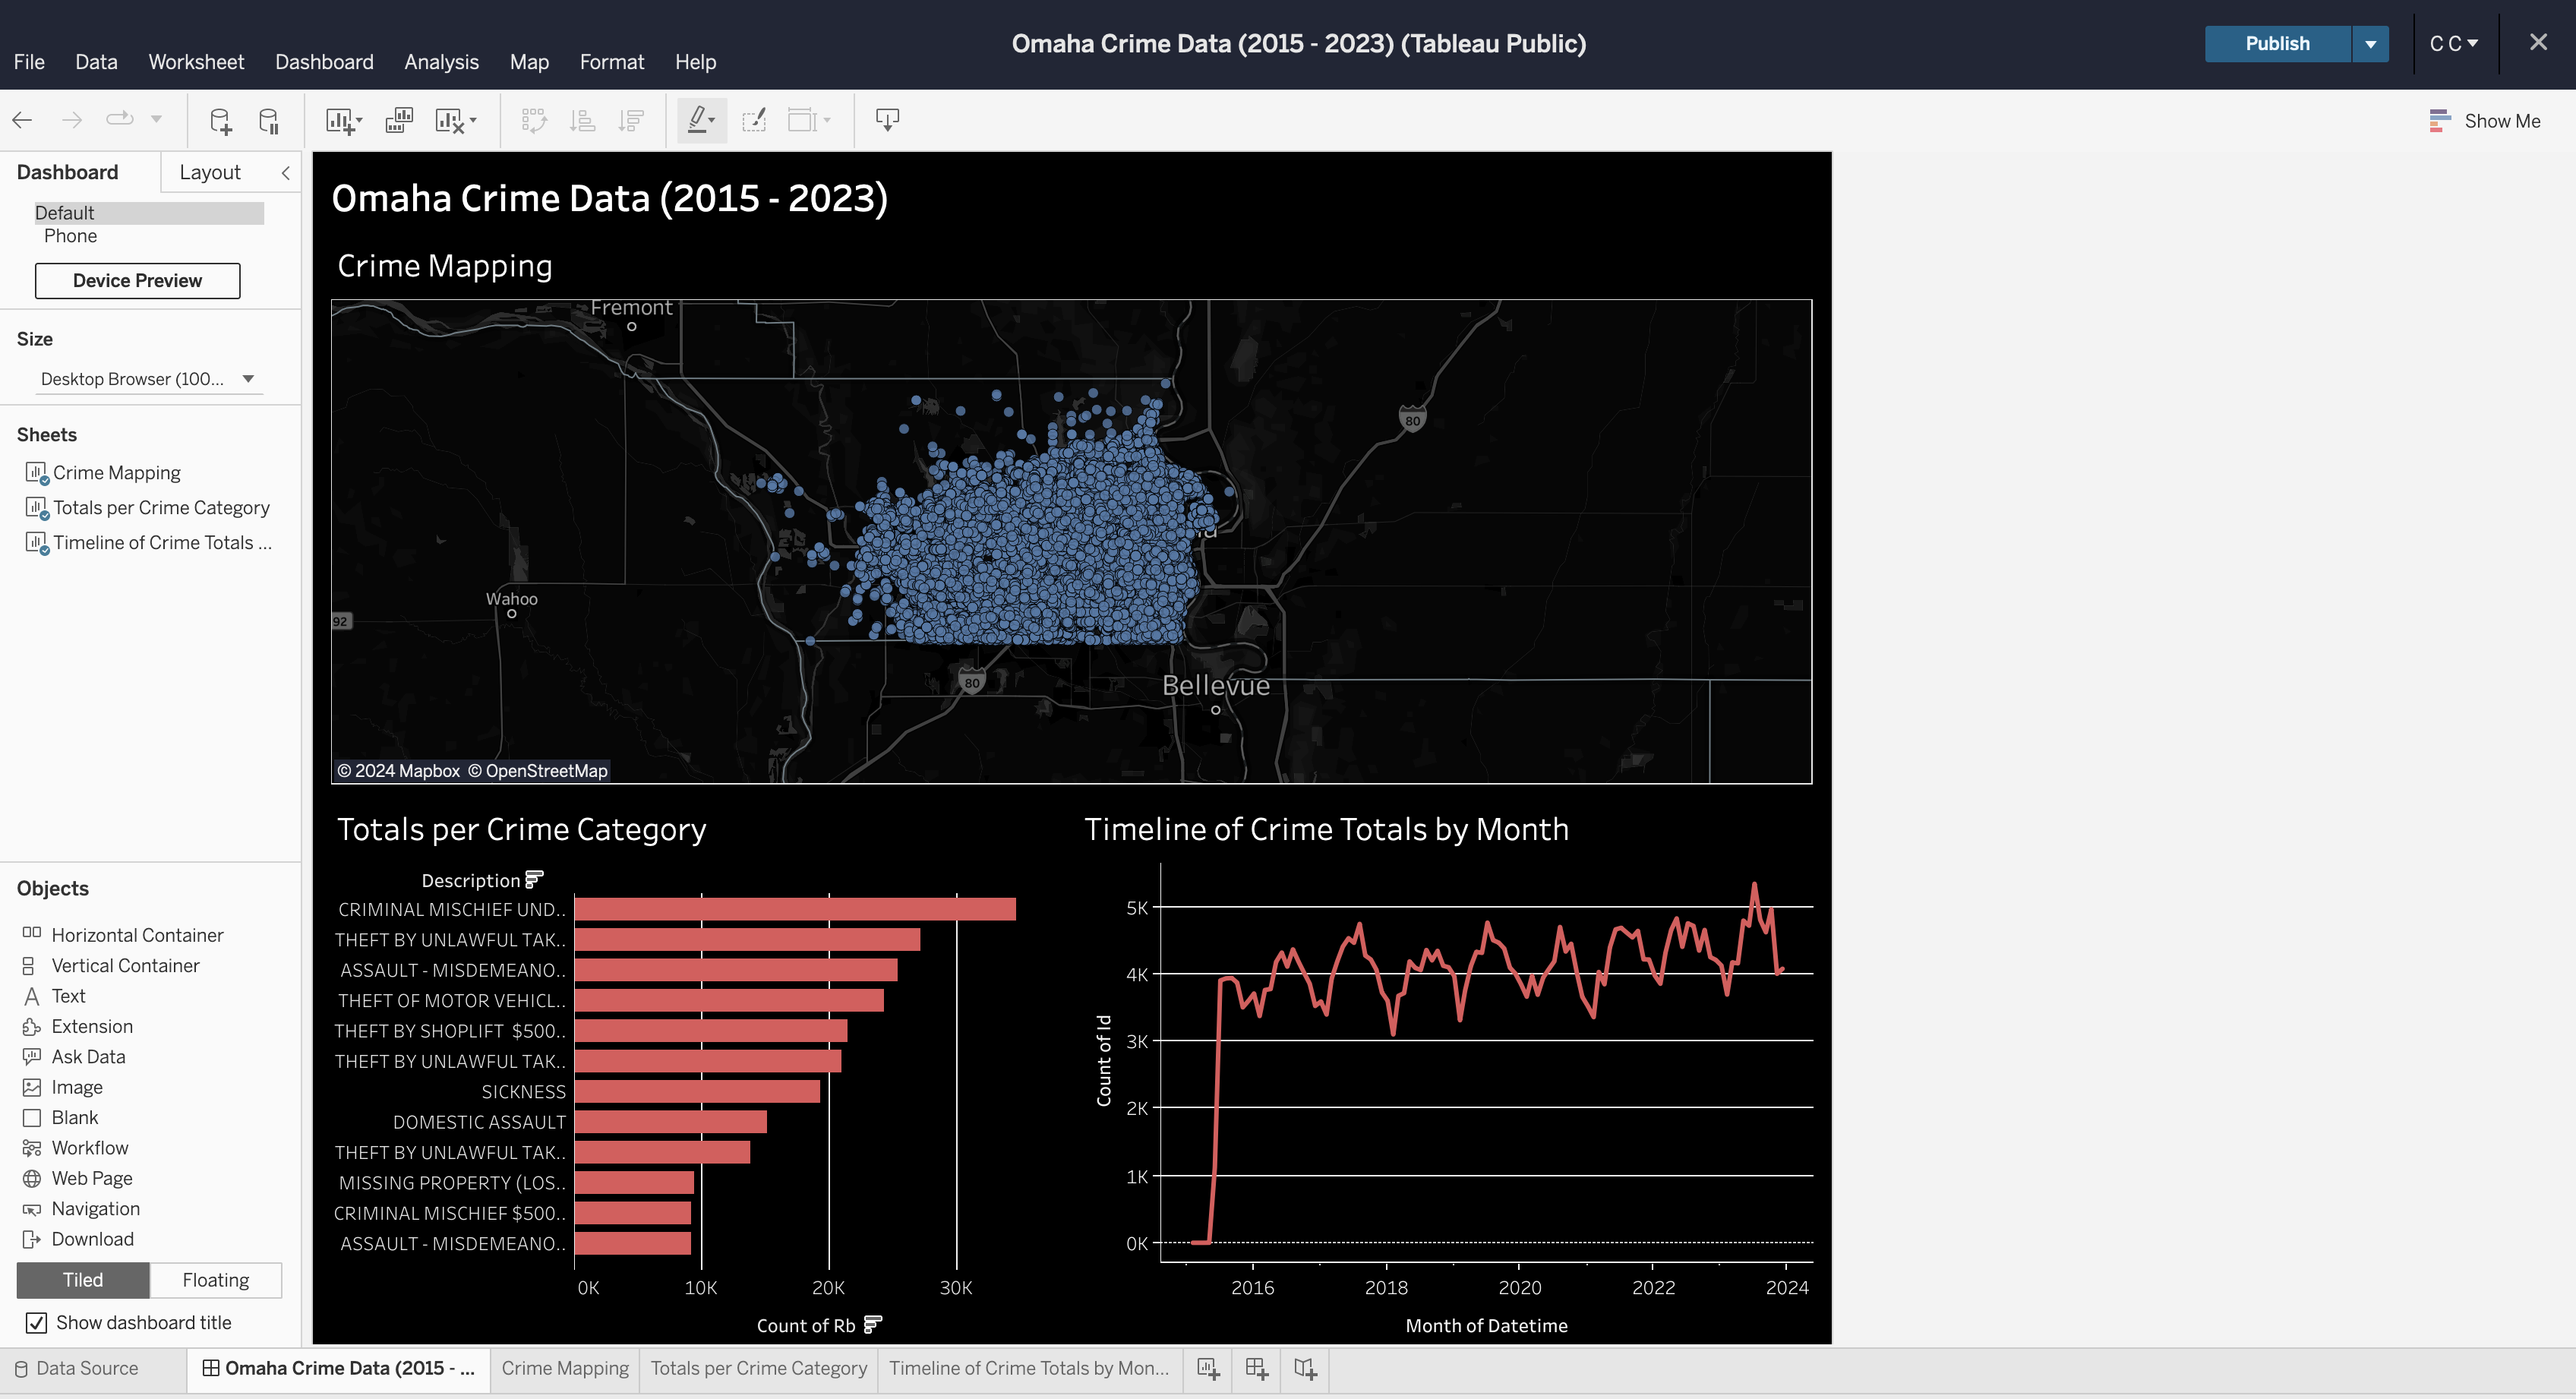 - ## Formatting You can explore a ton of different formatting options throughout the worksheets diff --git a/content/blog/2024-05-03-ubuntu-on-macos.md b/content/blog/2024-05-03-ubuntu-on-macos.md index df71eb1..b9b6732 100644 --- a/content/blog/2024-05-03-ubuntu-on-macos.md +++ b/content/blog/2024-05-03-ubuntu-on-macos.md @@ -41,9 +41,6 @@ Page](https://img.cleberg.net/blog/20240503-ubuntu-on-macos/create.png) Once created, the dialog will close and you will be presented with your new list of machines. Simply double-click on a machine to run it. -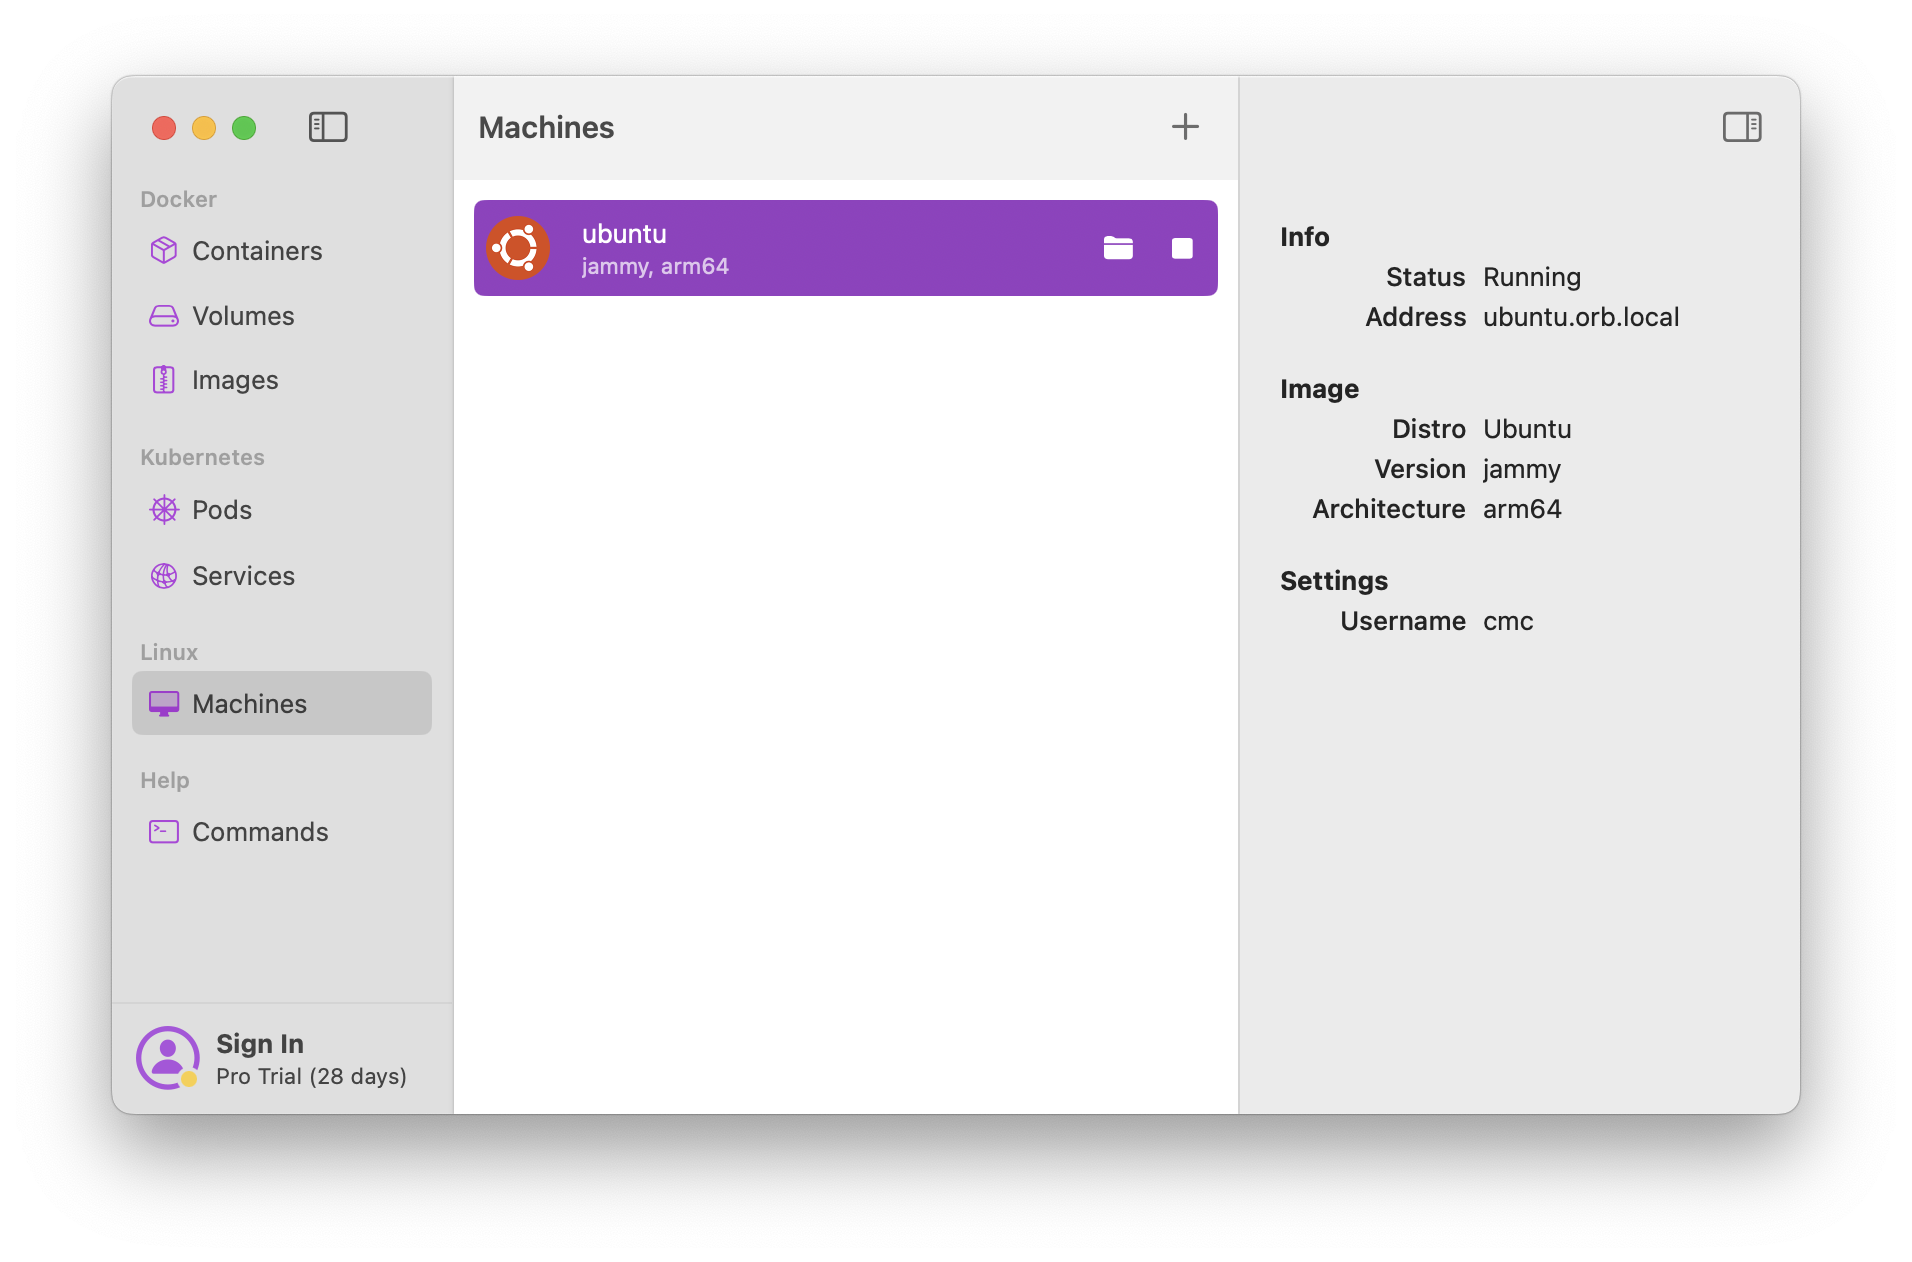 - When you run the machine for the first time, it may warn you that a program is attempting to run a shell script. You can choose to manually inspect this shell script via the provided path if you wish. When you're comfortable with the |