
diff options
| author | Christian Cleberg <hello@cleberg.net> | 2024-01-08 20:11:17 -0600 |
|---|---|---|
| committer | Christian Cleberg <hello@cleberg.net> | 2024-01-08 20:11:17 -0600 |
| commit | 25945b8fead989cca09a23983623b63ce36dcc0c (patch) | |
| tree | 0dfc869ce8b028e04ce9da196af08779780915ce /content/blog/2022-03-03-financial-database.md | |
| parent | 22b526be60bf4257c2a1d58a5fad59cf6b044375 (diff) | |
| download | cleberg.net-25945b8fead989cca09a23983623b63ce36dcc0c.tar.gz cleberg.net-25945b8fead989cca09a23983623b63ce36dcc0c.tar.bz2 cleberg.net-25945b8fead989cca09a23983623b63ce36dcc0c.zip | |
feat: total re-write from Emacs org-mode to Zola markdown
Diffstat (limited to 'content/blog/2022-03-03-financial-database.md')
| -rw-r--r-- | content/blog/2022-03-03-financial-database.md | 271 |
1 files changed, 271 insertions, 0 deletions
diff --git a/content/blog/2022-03-03-financial-database.md b/content/blog/2022-03-03-financial-database.md new file mode 100644 index 0000000..e3a1d81 --- /dev/null +++ b/content/blog/2022-03-03-financial-database.md @@ -0,0 +1,271 @@ ++++ +date = 2022-03-03 +title = "Maintaining a Personal Financial Database" +description = "An example project showing to build and maintain a simple financial database." ++++ + +## Personal Financial Tracking + +For the last 6-ish years, I've tracked my finances in a spreadsheet. +This is common practice in the business world, but any good dev will +cringe at the thought of storing long-term data in a spreadsheet. A +spreadsheet is not for long-term storage or as a source of data to pull +data/reports. + +As I wanted to expand the functionality of my financial data (e.g., +adding more reports), I decided to migrate the data into a database. To +run reports, I would query the database and use a language like Python +or Javascript to process the data, perform calculations, and visualize +the data. + +## SQLite + +When choosing the type of database I wanted to use for this project, I +was split between three options: + +1. MySQL: The database I have the most experience with and have used + for years. +2. PostgreSQL: A database I'm new to, but want to learn. +3. SQLite: A database that I've used for a couple projects and have + moderate experience. + +I ended up choosing SQLite since it can be maintained within a single +`.sqlite` file, which allows me more flexibility for storage +and backup. I keep this file in my cloud storage and pull it up whenever +needed. + +### GUI Editing + +Since I didn't want to try and import 1000--1500 records into my new +database via the command line, I opted to use [DB Browser for SQLite +(DB4S)](https://sqlitebrowser.org/) as a GUI tool. This application is +excellent, and I don't see myself going back to the CLI when working in +this database. + +DB4S allows you to copy a range of cells from a spreadsheet and paste it +straight into the SQL table. I used this process for all 36 accounts, +1290 account statements, and 126 pay statements. Overall, I'm guessing +this took anywhere between 4--8 hours. In comparison, it probably took +me 2-3 days to initially create the spreadsheet. + +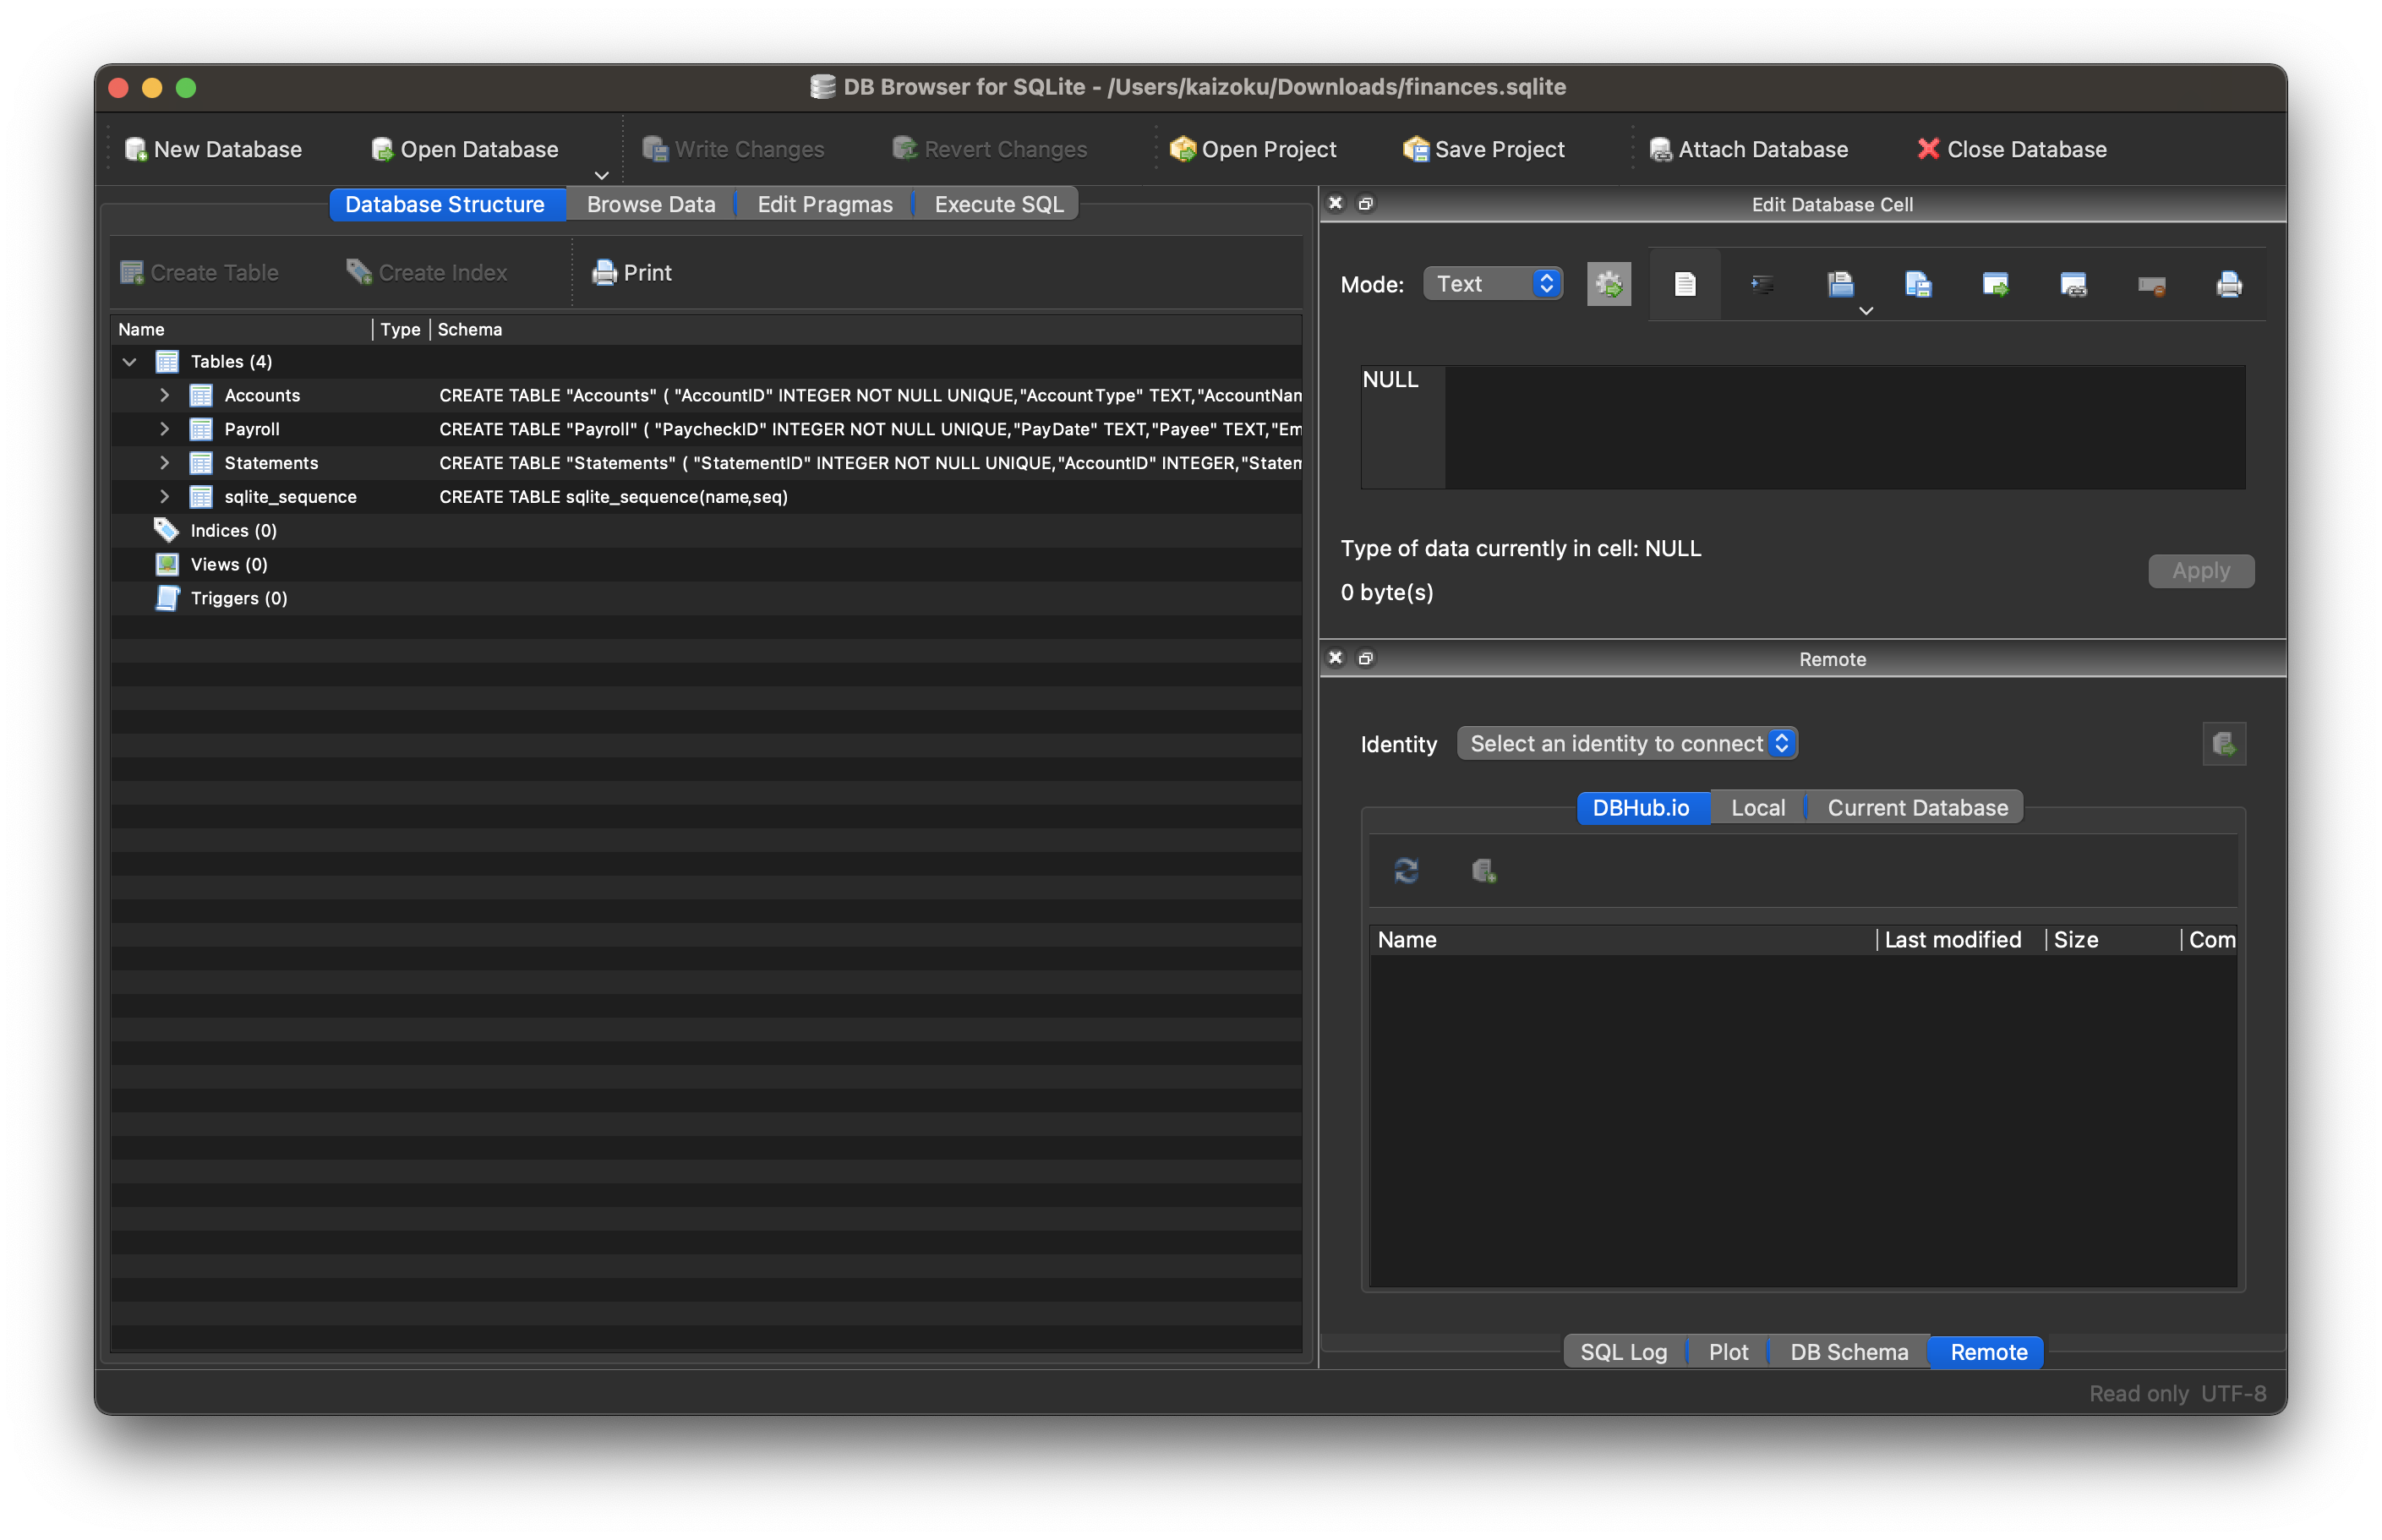 + +### Schema + +The schema for this database is actually extremely simple and involves +only three tables (for now): + +1. Accounts +2. Statements +3. Payroll + +**Accounts** + +The Accounts table contains summary information about an account, such +as a car loan or a credit card. By viewing this table, you can find +high-level data, such as interest rate, credit line, or owner. + +```sql +CREATE TABLE "Accounts" ( + "AccountID" INTEGER NOT NULL UNIQUE, + "AccountType" TEXT, + "AccountName" TEXT, + "InterestRate" NUMERIC, + "CreditLine" NUMERIC, + "State" TEXT, + "Owner" TEXT, + "Co-Owner" TEXT, + PRIMARY KEY("AccountID" AUTOINCREMENT) +) +``` + +**Statements** + +The Statements table uses the same unique identifier as the Accounts +table, meaning you can join the tables to find a monthly statement for +any of the accounts listed in the Accounts table. Each statement has an +account ID, statement date, and total balance. + +```sql +CREATE TABLE "Statements" ( + "StatementID" INTEGER NOT NULL UNIQUE, + "AccountID" INTEGER, + "StatementDate" INTEGER, + "Balance" NUMERIC, + PRIMARY KEY("StatementID" AUTOINCREMENT), + FOREIGN KEY("AccountID") REFERENCES "Accounts"("AccountID") +) +``` + +**Payroll** + +The Payroll table is a separate entity, unrelated to the Accounts or +Statements tables. This table contains all information you would find on +a pay statement from an employer. As you change employers or obtain new +perks/benefits, just add new columns to adapt to the new data. + +```sql +CREATE TABLE "Payroll" ( + "PaycheckID" INTEGER NOT NULL UNIQUE, + "PayDate" TEXT, + "Payee" TEXT, + "Employer" TEXT, + "JobTitle" TEXT, + "IncomeRegular" NUMERIC, + "IncomePTO" NUMERIC, + "IncomeHoliday" NUMERIC, + "IncomeBonus" NUMERIC, + "IncomePTOPayout" NUMERIC, + "IncomeReimbursements" NUMERIC, + "FringeHSA" NUMERIC, + "FringeStudentLoan" NUMERIC, + "Fringe401k" NUMERIC, + "PreTaxMedical" NUMERIC, + "PreTaxDental" NUMERIC, + "PreTaxVision" NUMERIC, + "PreTaxLifeInsurance" NUMERIC, + "PreTax401k" NUMERIC, + "PreTaxParking" NUMERIC, + "PreTaxStudentLoan" NUMERIC, + "PreTaxOther" NUMERIC, + "TaxFederal" NUMERIC, + "TaxSocial" NUMERIC, + "TaxMedicare" NUMERIC, + "TaxState" NUMERIC, + PRIMARY KEY("PaycheckID" AUTOINCREMENT) +) +``` + +### Python Reporting + +Once I created the database tables and imported all my data, the only +step left was to create a process to report and visualize on various +aspects of the data. + +In order to explore and create the reports I'm interested in, I +utilized a two-part process involving Jupyter Notebooks and Python +scripts. + +1. Step 1: Jupyter Notebooks + + When I need to explore data, try different things, and re-run my + code cell-by-cell, I use Jupyter Notebooks. For example, I explored + the `Accounts` table until I found the following useful + information: + + ```python + import sqlite3 + import pandas as pd + import matplotlib + + # Set up database filename and connect + db = "finances.sqlite" + connection = sqlite3.connect(db) + df = pd.read_sql_query("SELECT * FROM Accounts", connection) + + # Set global matplotlib variables + %matplotlib inline + matplotlib.rcParams['text.color'] = 'white' + matplotlib.rcParams['axes.labelcolor'] = 'white' + matplotlib.rcParams['xtick.color'] = 'white' + matplotlib.rcParams['ytick.color'] = 'white' + matplotlib.rcParams['legend.labelcolor'] = 'black' + + # Display graph + df.groupby(['AccountType']).sum().plot.pie(title='Credit Line by Account Type', y='CreditLine', figsize=(5,5), autopct='%1.1f%%') + ``` + +2. Step 2: Python Scripts + + Once I explored enough through the notebooks and had a list of + reports I wanted, I moved on to create a Python project with the + following structure: + + ```example + finance/ + ├── notebooks/ + │ │ ├── account_summary.ipynb + │ │ ├── account_details.ipynb + │ │ └── payroll.ipynb + ├── public/ + │ │ ├── image-01.png + │ │ └── image-0X.png + ├── src/ + │ └── finance.sqlite + ├── venv/ + ├── _init.py + ├── database.py + ├── process.py + ├── requirements.txt + └── README.md + ``` + + This structure allows me to: + + 1. Compile all required python packages into + `requirements.txt` for easy installation if I move to + a new machine. + 2. Activate a virtual environment in `venv/` so I don't + need to maintain a system-wide Python environment just for this + project. + 3. Keep my `notebooks/` folder to continuously explore + the data as I see fit. + 4. Maintain a local copy of the database in `src/` for + easy access. + 5. Export reports, images, HTML files, etc. to + `public/`. + + Now, onto the differences between the code in a Jupyter Notebook and + the actual Python files. To create the report in the Notebook + snippet above, I created the following function inside + `process.py`: + + ```python + # Create summary pie chart + def summary_data(accounts: pandas.DataFrame) -> None: + accounts_01 = accounts[accounts["Owner"] == "Person01"] + accounts_02 = accounts[accounts["Owner"] == "Person02"] + for x in range(1, 4): + if x == 1: + df = accounts + account_string = "All Accounts" + elif x == 2: + df = accounts_01 + account_string = "Person01's Accounts" + elif x == 3: + df = accounts_02 + account_string = "Person02's Accounts" + print(f"Generating pie chart summary image for {account_string}...") + summary_chart = ( + df.groupby(["AccountType"]) + .sum() + .plot.pie( + title=f"Credit Line by Type for {account_string}", + y="CreditLine", + autopct="%1.1f%%", + ) + ) + summary_chart.figure.savefig(f"public/summary_chart_{x}.png", dpi=1200) + ``` + + The result? A high-quality pie chart that is read directly by the + `public/index.html` template I use. + + 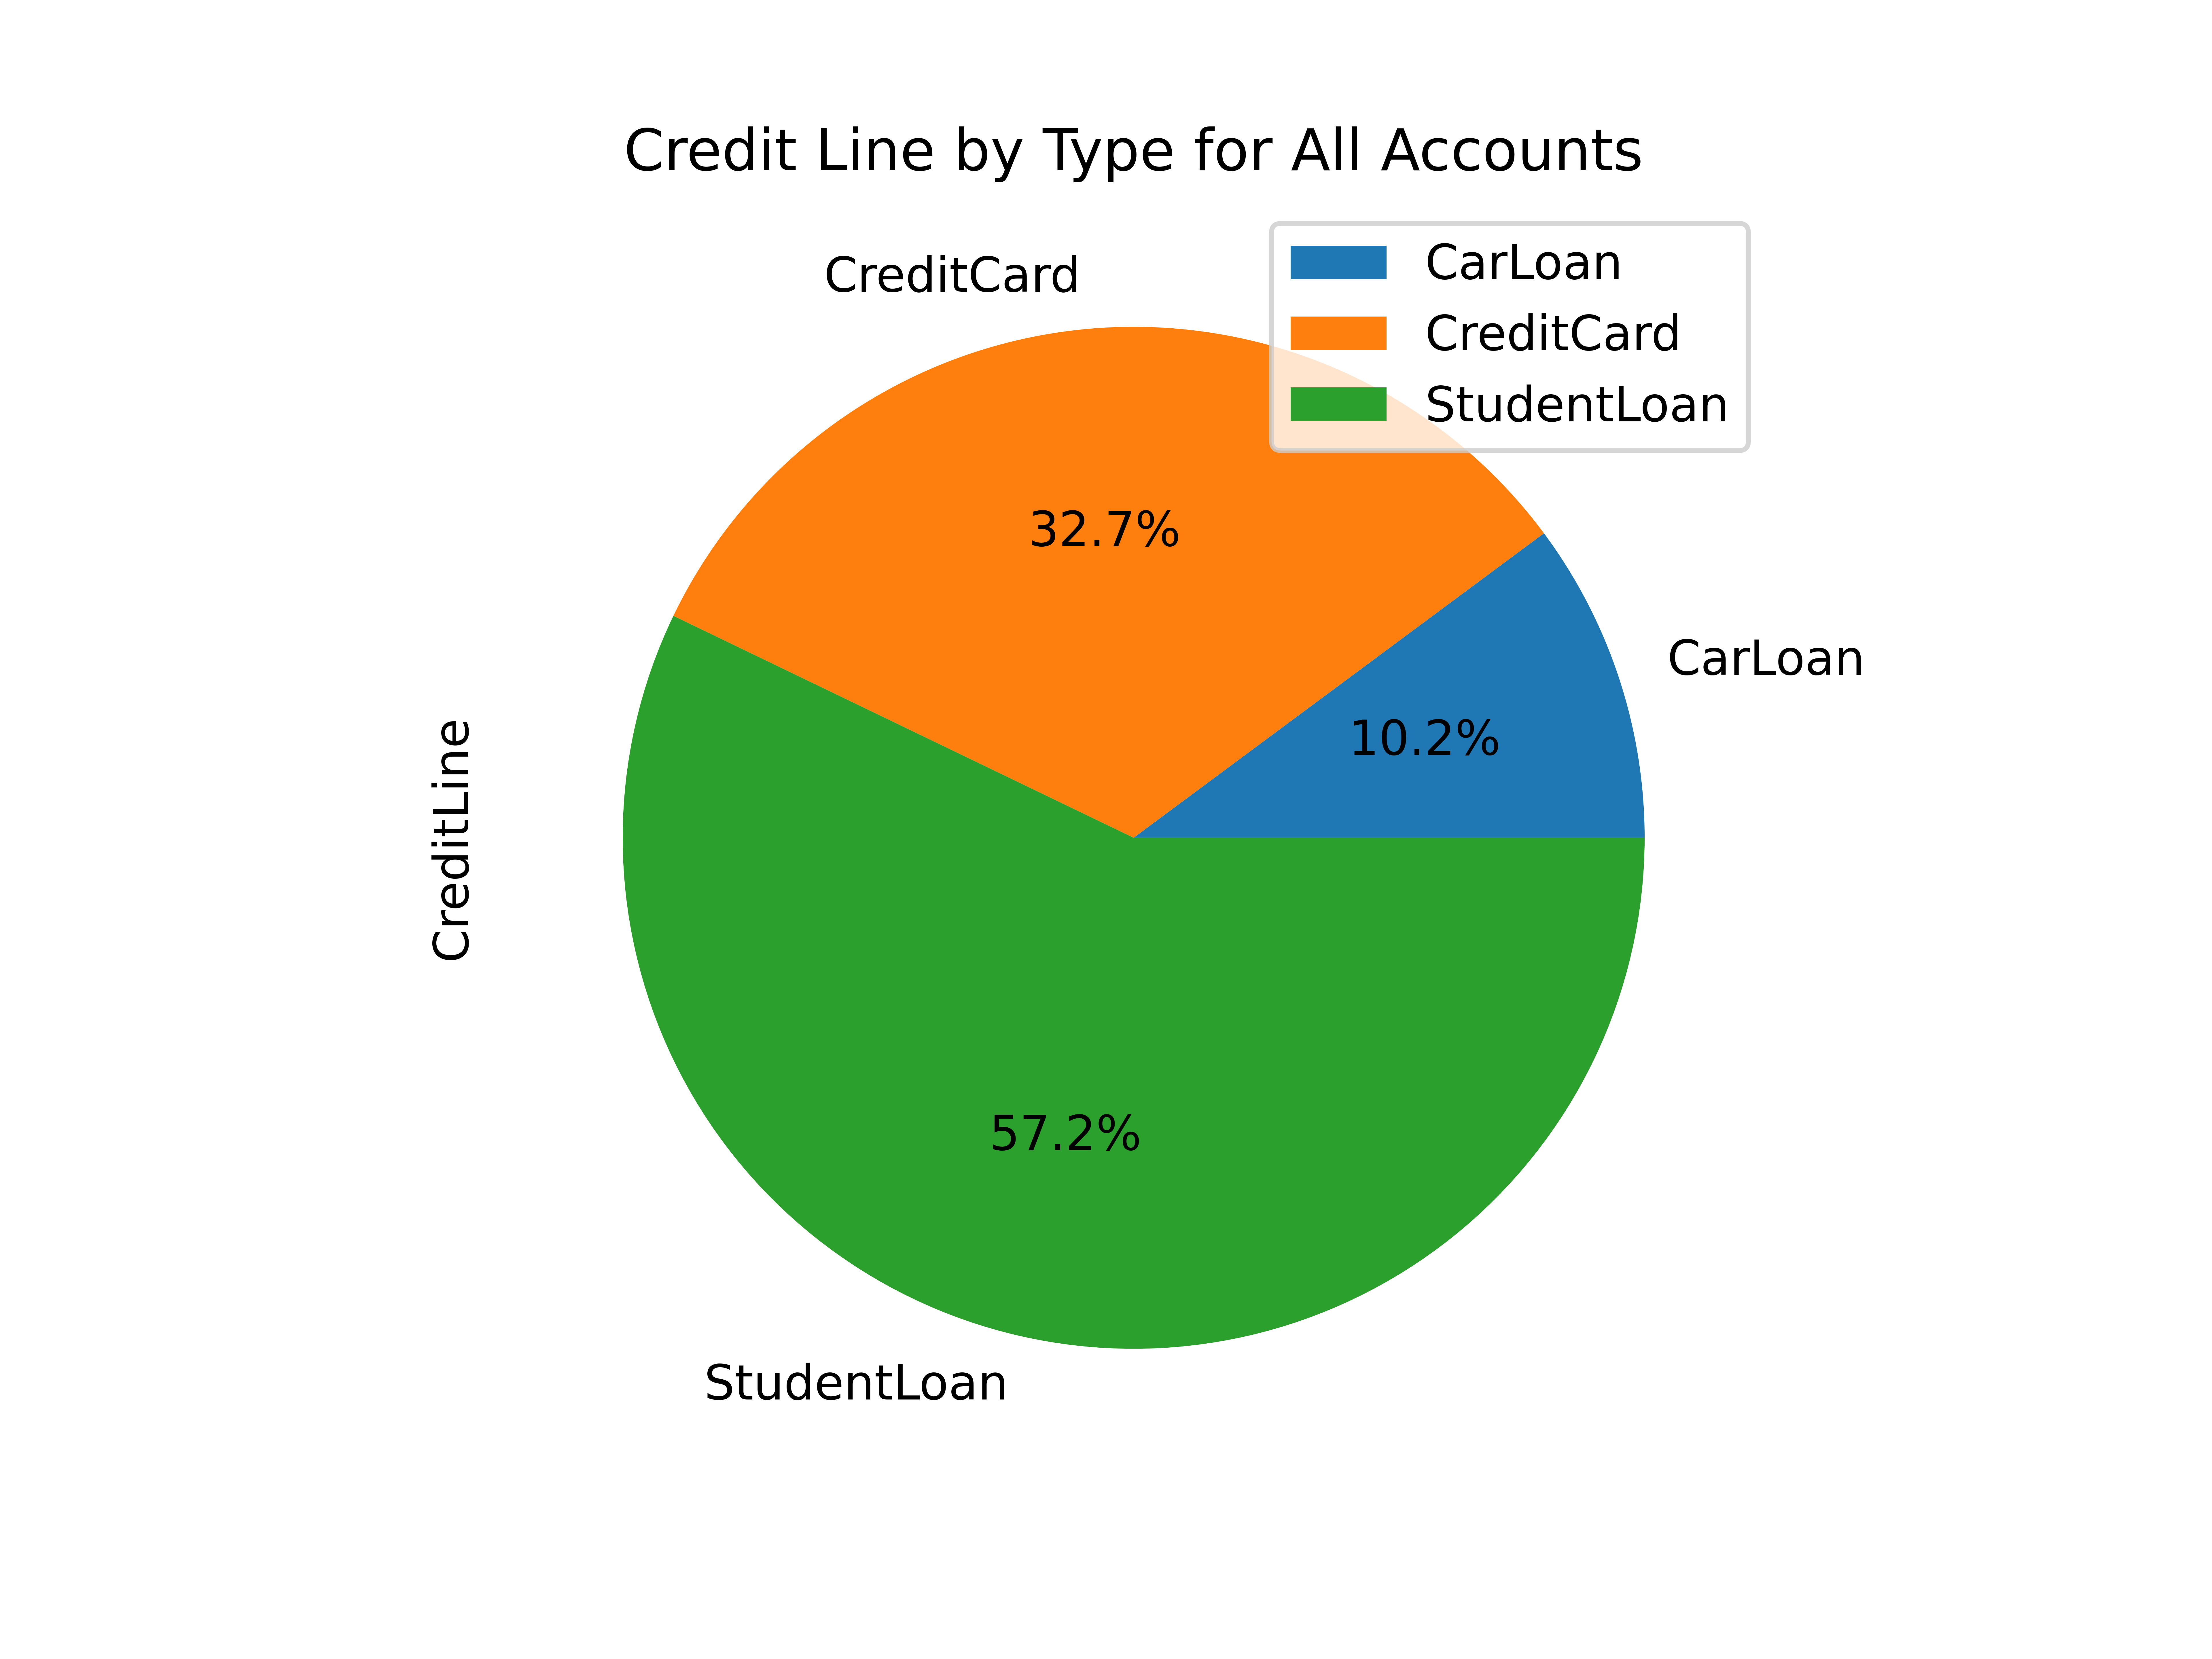 + + Other charts generated by this project include: + + - Charts of account balances over time. + - Line chart of effective tax rate (taxes divided by taxable + income). + - Salary projections and error limits using past income and + inflation rates. + - Multi-line chart of gross income, taxable income, and net + income. + + The best thing about this project? I can improve it at any given + time, shaping it into whatever helps me the most for that time. I + imagine that I will be introducing an asset tracking table soon to + track the depreciating value of cars, houses, etc. Who knows what's + next? |