
diff options
| author | Christian Cleberg <hello@cleberg.net> | 2024-07-02 23:24:15 -0500 |
|---|---|---|
| committer | Christian Cleberg <hello@cleberg.net> | 2024-07-02 23:24:15 -0500 |
| commit | 89e6c0f9c8edd029aeeb553dcb11b62c878d11b1 (patch) | |
| tree | 55a4fd7d3de25de21fe296c8353642bae1e4579b /content/blog/2024-01-26-audit-dashboard.md | |
| parent | c5a2b7970f2187456dd094105e38b1d5482cb90f (diff) | |
| download | cleberg.net-89e6c0f9c8edd029aeeb553dcb11b62c878d11b1.tar.gz cleberg.net-89e6c0f9c8edd029aeeb553dcb11b62c878d11b1.tar.bz2 cleberg.net-89e6c0f9c8edd029aeeb553dcb11b62c878d11b1.zip | |
fix 2024 blog posts for missing images
Diffstat (limited to 'content/blog/2024-01-26-audit-dashboard.md')
| -rw-r--r-- | content/blog/2024-01-26-audit-dashboard.md | 36 |
1 files changed, 5 insertions, 31 deletions
diff --git a/content/blog/2024-01-26-audit-dashboard.md b/content/blog/2024-01-26-audit-dashboard.md index 73cc0a6..fabb0e3 100644 --- a/content/blog/2024-01-26-audit-dashboard.md +++ b/content/blog/2024-01-26-audit-dashboard.md @@ -9,10 +9,8 @@ Alteryx and Power BI are powerful tools that can help turn your old-school audit trackers into interactive tools that provide useful insights and potential action plans. -With these tools, we are going to build the following dashboard: - -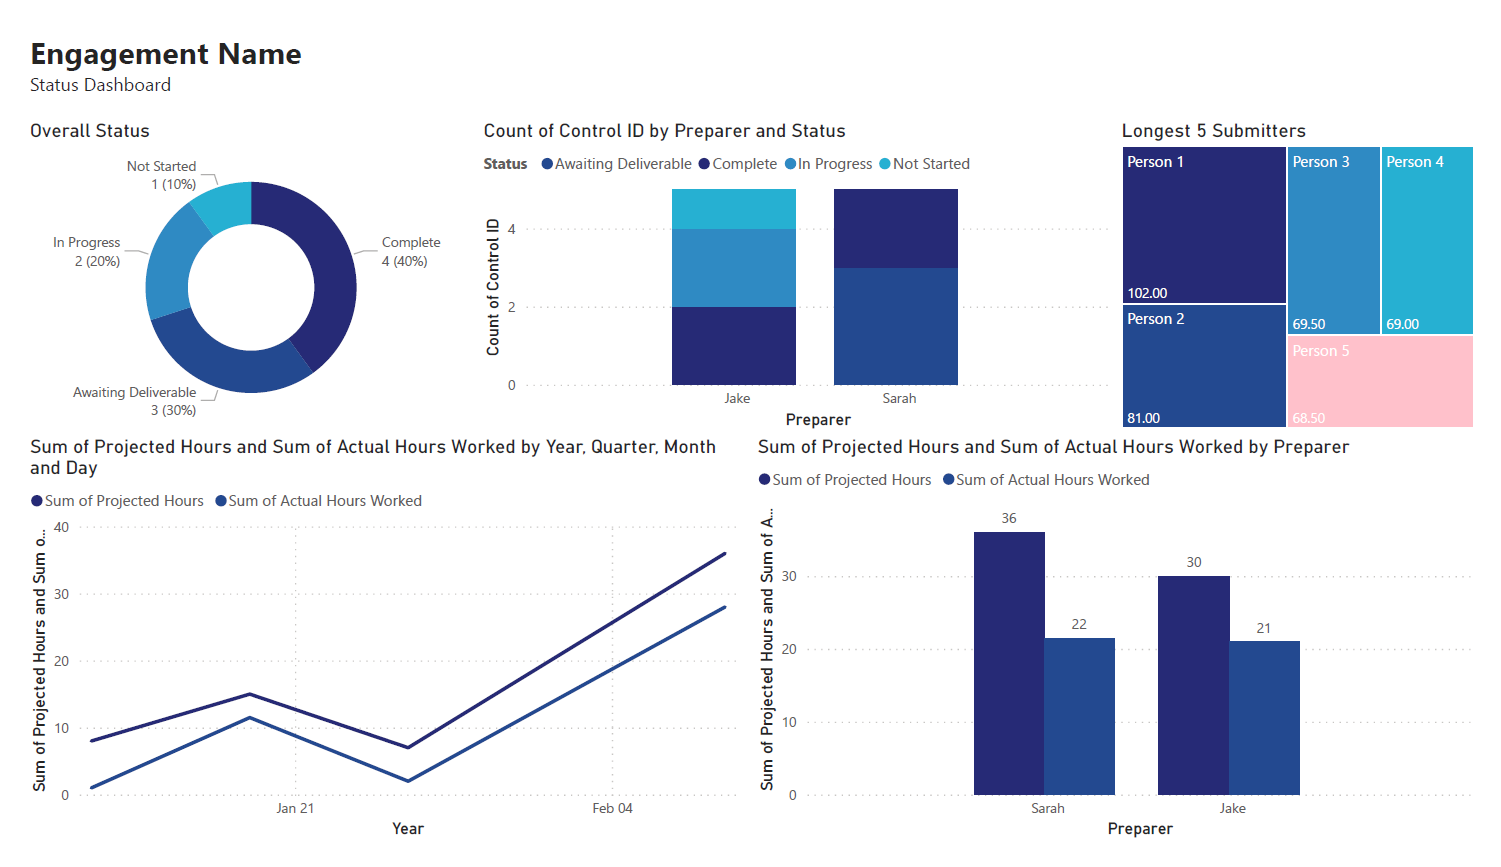 -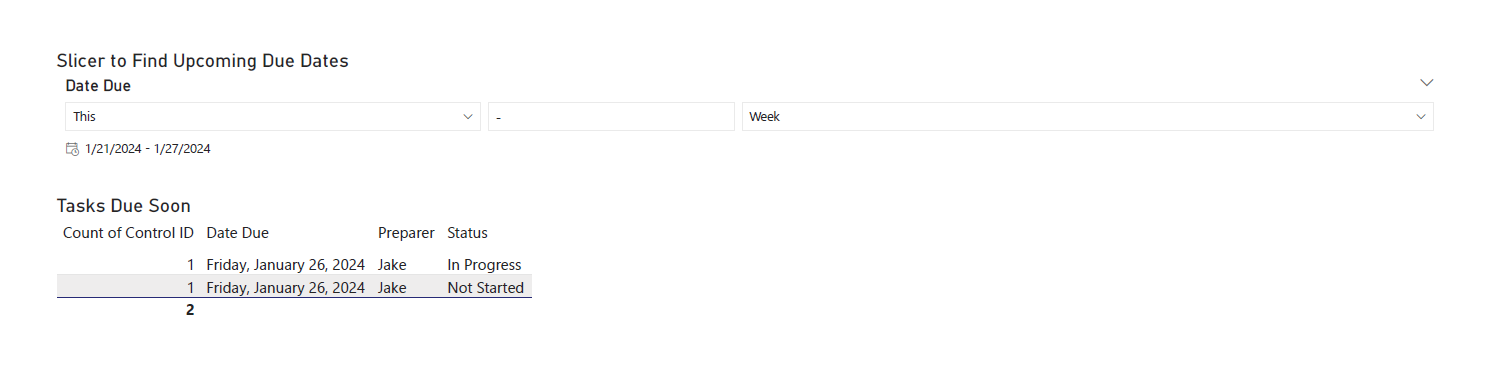 +With these tools, we are going to build a dashboard that can effectively +communicate project status. # Requirements @@ -37,9 +35,6 @@ and let Alteryx determine the format for you. For this example, we will be importing an Excel file and changing the `Start Data Import on Line` variable to `2`. - - ## Transform Data Next, let's replace null data and remove whitespace to clean up our data. We can @@ -53,17 +48,11 @@ Ensure that the following options are enabled: - Remove Unwanted Characters - Leading and Trailing Whitespace -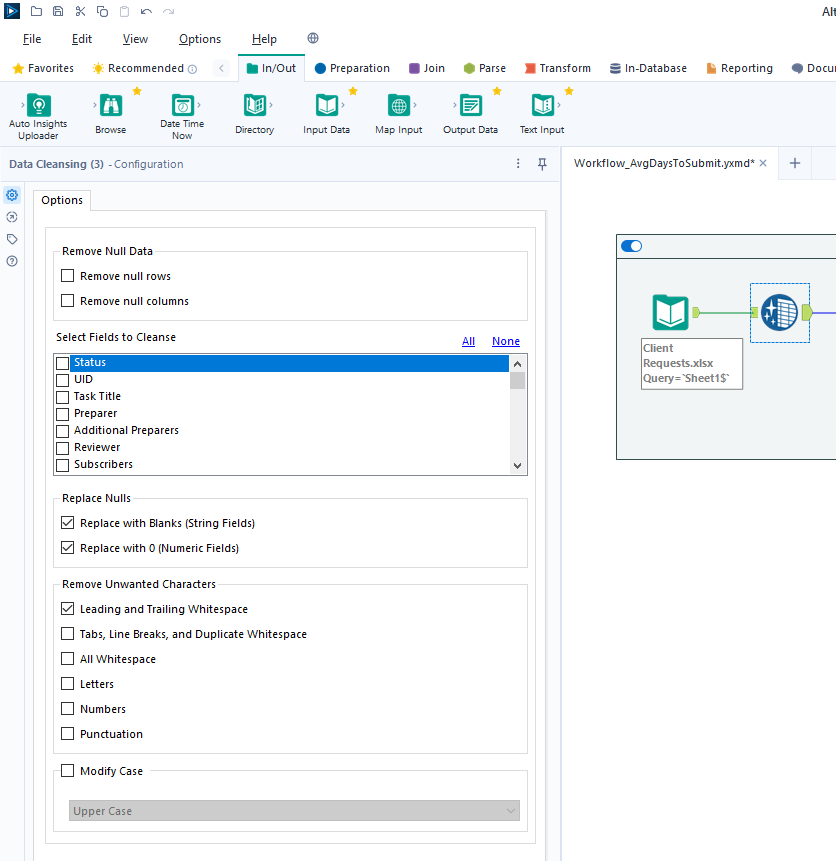 - For our next step, we will transform the date fields from strings to datetime format. Add a `Datetime` tool for each field you want to transform - in the example below, I am using the tool twice for the "Started On" and "Submitted On" fields. -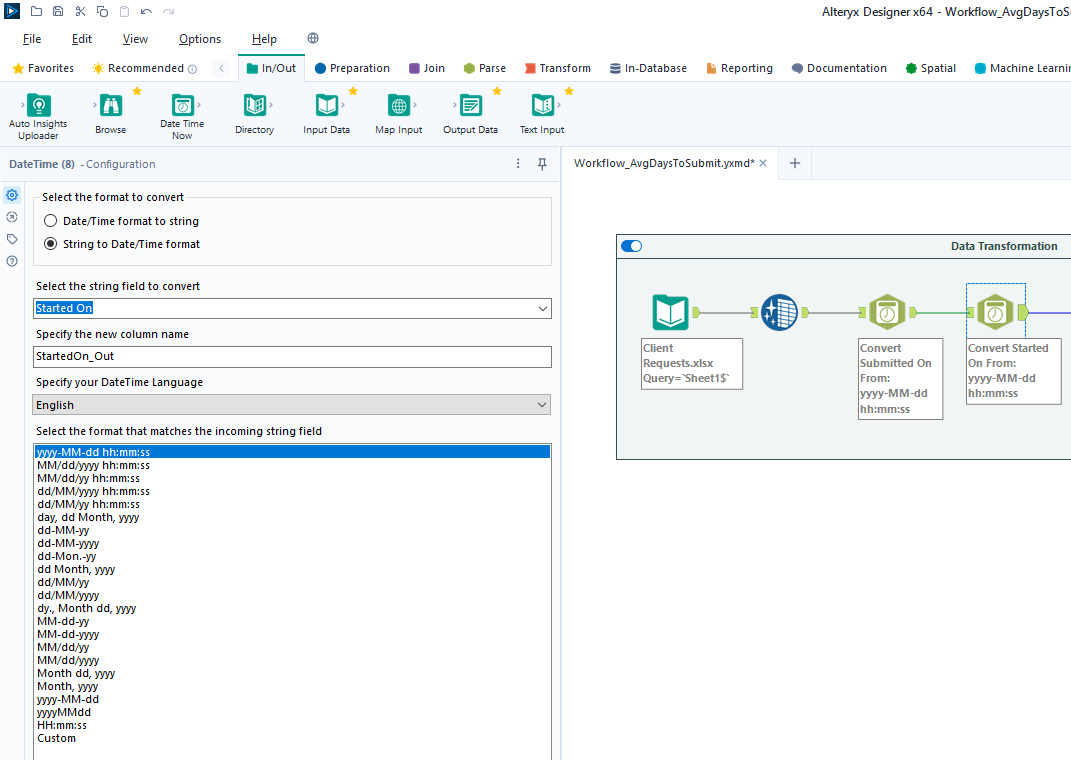 - Now that the dates are in the correct format, let's perform a calculation based on those fields. Start by adding a `Filter` tool, naming a new Output Column, and pasting the formula below into it (the two fields used in this formula must @@ -71,19 +60,13 @@ match the output of the `Datetime` tools above): ```txt DateTimeDiff([SubmittedOn_Out],[StartedOn_Out], "days") -``` - -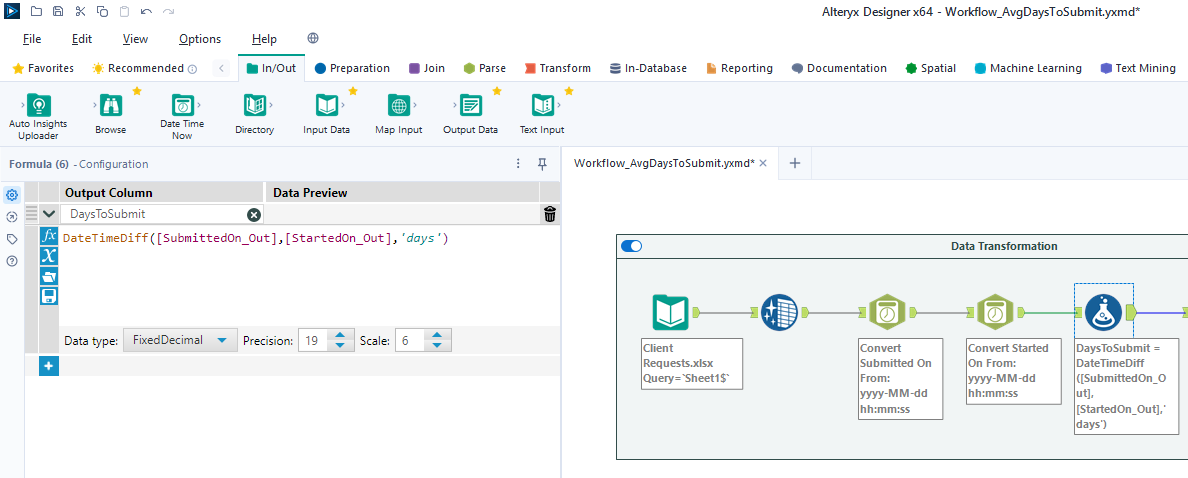 +` ## Export Data Finalize the process by exporting the transformed data set to a new file, for use in the following visualization step. -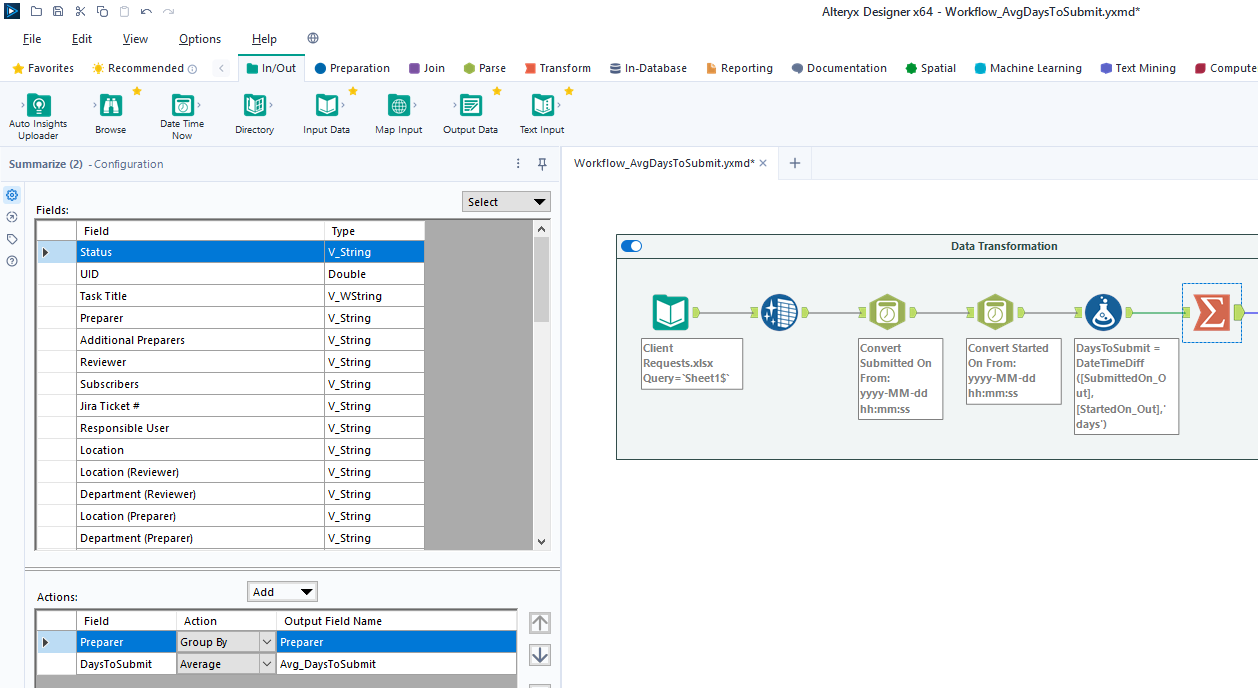 - # Power BI: Data Visualization ## Import Data @@ -98,19 +81,10 @@ for this project. During this process, I also imported the export from the Alteryx workflow above. Therefore, we have two different files available for use in our dashboard. - - -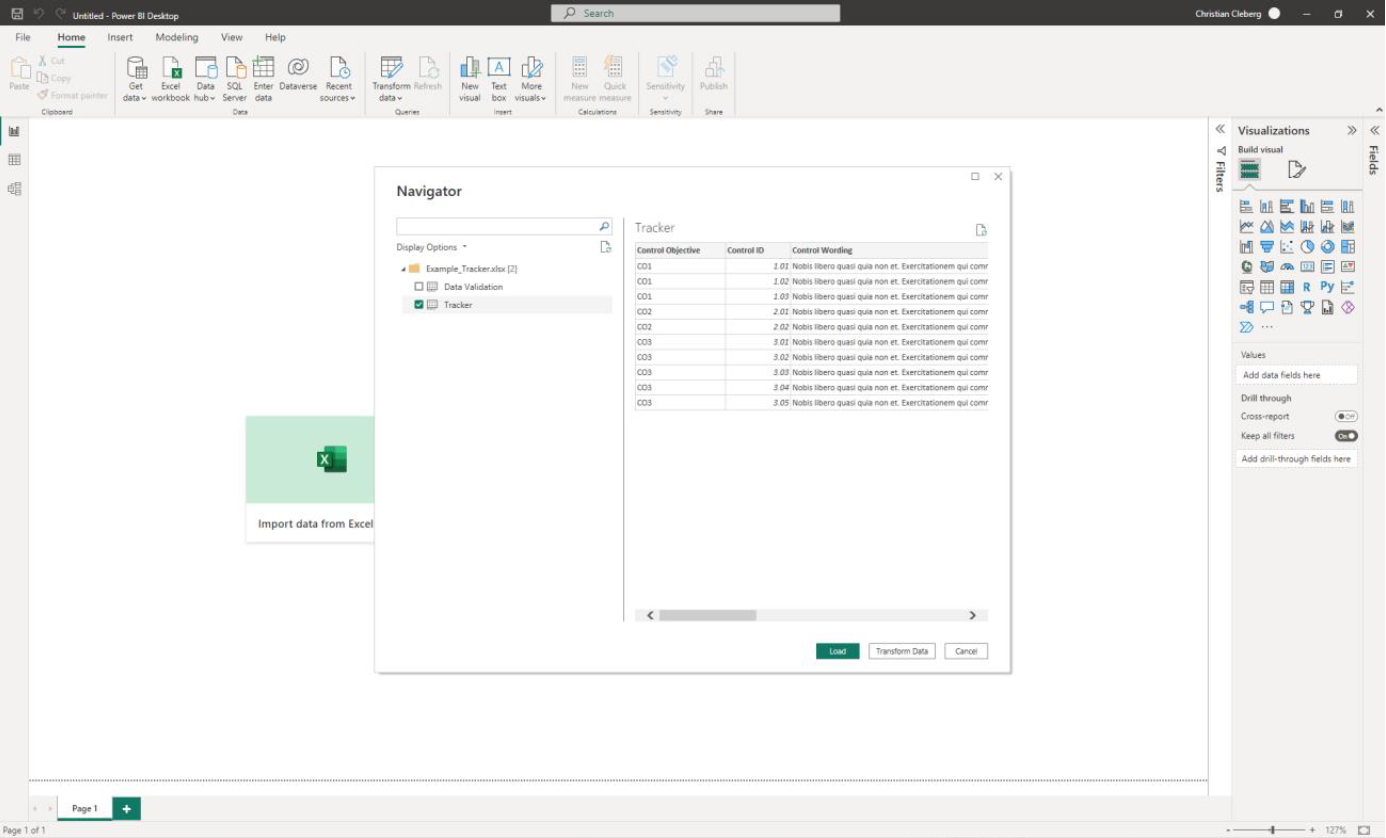 - ## Add Visuals -To create the dashboard below, you will need to follow the list instructions -below and format as needed: - - - +To create the dashboard, you will need to follow the list instructions +below and format as needed. Instructions to create the visuals above: |