
diff options
| author | Christian Cleberg <hello@cleberg.net> | 2024-05-01 21:45:52 -0500 |
|---|---|---|
| committer | Christian Cleberg <hello@cleberg.net> | 2024-05-01 21:45:52 -0500 |
| commit | dc1261d703ae1e1a14841b030888e3f87ff7c38f (patch) | |
| tree | 71139c9021b09704b2d45be3b64d54e2acbae55f /content/blog/2024-01-26-audit-dashboard.md | |
| parent | ba6b552c8256cc2e071c910ef7821c82443f1f82 (diff) | |
| download | cleberg.net-dc1261d703ae1e1a14841b030888e3f87ff7c38f.tar.gz cleberg.net-dc1261d703ae1e1a14841b030888e3f87ff7c38f.tar.bz2 cleberg.net-dc1261d703ae1e1a14841b030888e3f87ff7c38f.zip | |
prettier formatting and rewrap lines
Diffstat (limited to 'content/blog/2024-01-26-audit-dashboard.md')
| -rw-r--r-- | content/blog/2024-01-26-audit-dashboard.md | 97 |
1 files changed, 48 insertions, 49 deletions
diff --git a/content/blog/2024-01-26-audit-dashboard.md b/content/blog/2024-01-26-audit-dashboard.md index d274eb1..73cc0a6 100644 --- a/content/blog/2024-01-26-audit-dashboard.md +++ b/content/blog/2024-01-26-audit-dashboard.md @@ -18,11 +18,11 @@ With these tools, we are going to build the following dashboard: This project assumes the following: -- You have access to Alteryx Designer and Power BI Desktop. - - If you only have Power BI Desktop, you may need to perform some analysis - in Power BI instead of Alteryx. -- Your data is in a format that can be imported into Alteryx and/or Power BI. -- You have a basic understanding of data types and visualization. +- You have access to Alteryx Designer and Power BI Desktop. + - If you only have Power BI Desktop, you may need to perform some analysis + in Power BI instead of Alteryx. +- Your data is in a format that can be imported into Alteryx and/or Power BI. +- You have a basic understanding of data types and visualization. # Alteryx: Data Preparation & Analysis @@ -42,25 +42,24 @@ Import](https://img.cleberg.net/blog/20240126-audit-dashboard/alteryx_import.png ## Transform Data -Next, let's replace null data and remove whitespace to clean up our data. We -can do this with the `Data Cleansing` tool in the `Preparation` tab in the -Ribbon. +Next, let's replace null data and remove whitespace to clean up our data. We can +do this with the `Data Cleansing` tool in the `Preparation` tab in the Ribbon. Ensure that the following options are enabled: -- Replace Nulls - - Replace with Blanks (String Fields) - - Replace with 0 (Numeric Fields) -- Remove Unwanted Characters - - Leading and Trailing Whitespace +- Replace Nulls + - Replace with Blanks (String Fields) + - Replace with 0 (Numeric Fields) +- Remove Unwanted Characters + - Leading and Trailing Whitespace 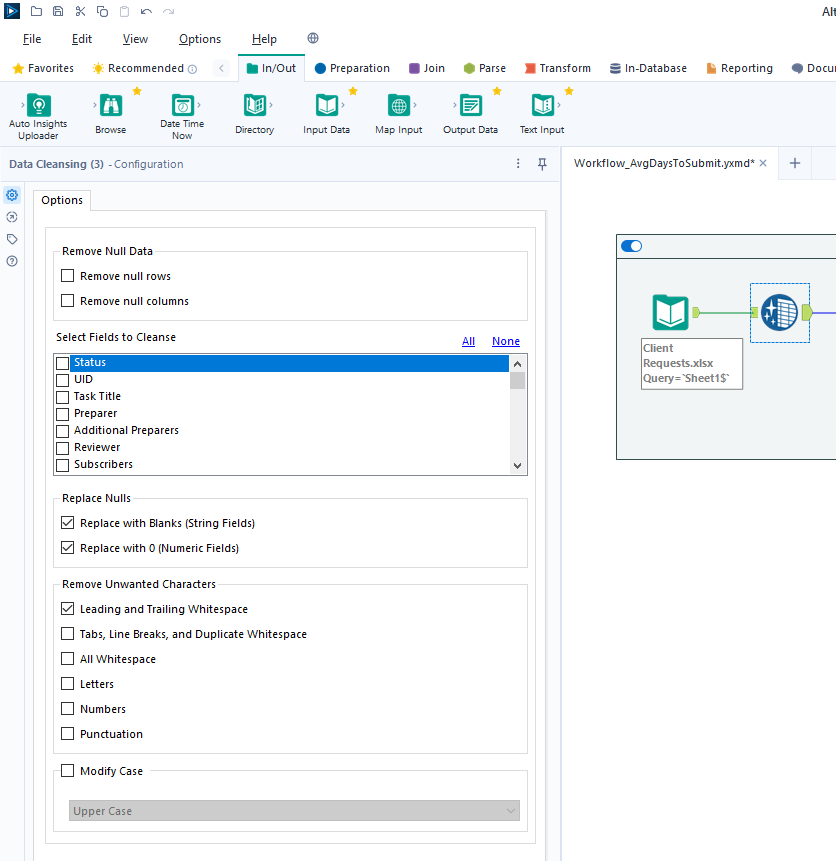 For our next step, we will transform the date fields from strings to datetime format. Add a `Datetime` tool for each field you want to transform - in the -example below, I am using the tool twice for the "Started On" and "Submitted -On" fields. +example below, I am using the tool twice for the "Started On" and "Submitted On" +fields. 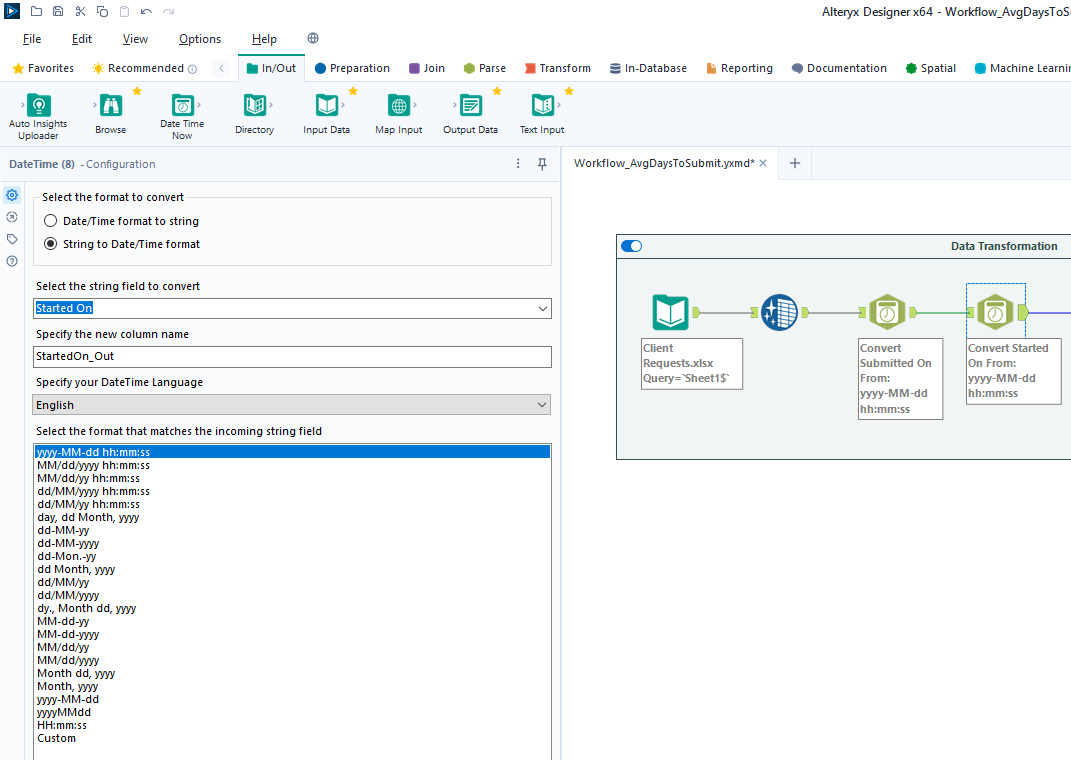 @@ -70,7 +69,7 @@ on those fields. Start by adding a `Filter` tool, naming a new Output Column, and pasting the formula below into it (the two fields used in this formula must match the output of the `Datetime` tools above): -``` txt +```txt DateTimeDiff([SubmittedOn_Out],[StartedOn_Out], "days") ``` @@ -93,8 +92,8 @@ To start, open the Power BI Desktop application. Upon first use, Power BI will ask if you want to open an existing dashboard or import new data. As we are creating our first dashboard, let's import our data. In my example -below, I'm importing data from the "Tracker" sheet of the Excel file I'm -using for this project. +below, I'm importing data from the "Tracker" sheet of the Excel file I'm using +for this project. During this process, I also imported the export from the Alteryx workflow above. Therefore, we have two different files available for use in our dashboard. @@ -115,25 +114,25 @@ below and format as needed: Instructions to create the visuals above: -- `Text Box`: Explain the name and purpose of the dashboard. You can also add - images and logos at the top of the dashboard. -- `Donut Chart`: Overall status of the project. - - `Legend`: Status - - `Values`: Count of Status -- `Stacked Column Chart`: Task count by assignee. - - `X-axis`: Preparer - - `Y-axis`: Count of Control ID - - `Legend`: Status -- `Treemap`: Top N client submitters by average days to submit. - - `Details`: Preparer - - `Values`: Sum of Avg~DaysToSubmit~ -- `Line Chart`: Projected vs. actual hours over time. -- `Clustered Bar Chart`: Projected vs. actual hours per person. -- `Slicer & Table` - Upcoming due dates. - - `Slicer`: - - `Values`: Date Due - - `Table`: - - `Columns`: Count of Control ID, Date Due, Preparer, Status +- `Text Box`: Explain the name and purpose of the dashboard. You can also add + images and logos at the top of the dashboard. +- `Donut Chart`: Overall status of the project. + - `Legend`: Status + - `Values`: Count of Status +- `Stacked Column Chart`: Task count by assignee. + - `X-axis`: Preparer + - `Y-axis`: Count of Control ID + - `Legend`: Status +- `Treemap`: Top N client submitters by average days to submit. + - `Details`: Preparer + - `Values`: Sum of Avg~DaysToSubmit~ +- `Line Chart`: Projected vs. actual hours over time. +- `Clustered Bar Chart`: Projected vs. actual hours per person. +- `Slicer & Table` - Upcoming due dates. + - `Slicer`: + - `Values`: Date Due + - `Table`: + - `Columns`: Count of Control ID, Date Due, Preparer, Status ## Format the Dashboard @@ -144,18 +143,18 @@ created by your organization. For each visual, you can click the `Format` button in the `Visualizations` side pane and explore the options. You can custom options such as: -- Visual - - Legend - - Colors - - Data labels - - Category labels -- General - - Properties - - Title - - Effects - - Header icons - - Tooltips - - Alt text +- Visual + - Legend + - Colors + - Data labels + - Category labels +- General + - Properties + - Title + - Effects + - Header icons + - Tooltips + - Alt text You can always look online for inspiration when trying to decide how best to organize and style your dashboard. |