
diff options
Diffstat (limited to 'content/blog/2020-07-20-video-game-sales.md')
| -rw-r--r-- | content/blog/2020-07-20-video-game-sales.md | 26 |
1 files changed, 0 insertions, 26 deletions
diff --git a/content/blog/2020-07-20-video-game-sales.md b/content/blog/2020-07-20-video-game-sales.md index 1ada35d..9b78e9b 100644 --- a/content/blog/2020-07-20-video-game-sales.md +++ b/content/blog/2020-07-20-video-game-sales.md @@ -43,9 +43,6 @@ df = pd.read_csv(file) df ``` -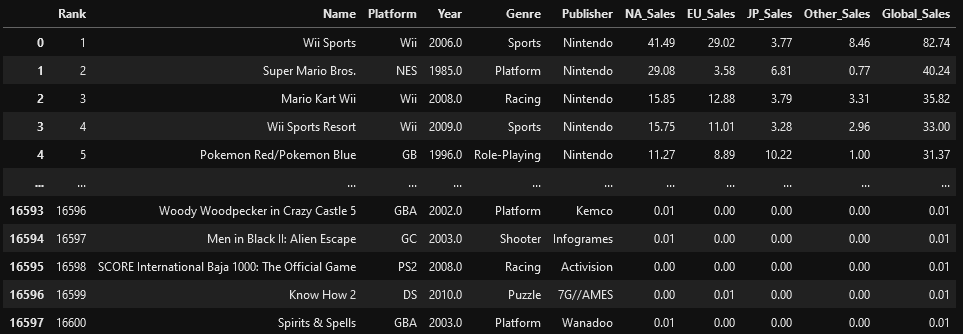 - # Explore the Data ```python @@ -54,8 +51,6 @@ Results](https://img.cleberg.net/blog/20200720-data-exploration-video-game-sales df.describe() ``` -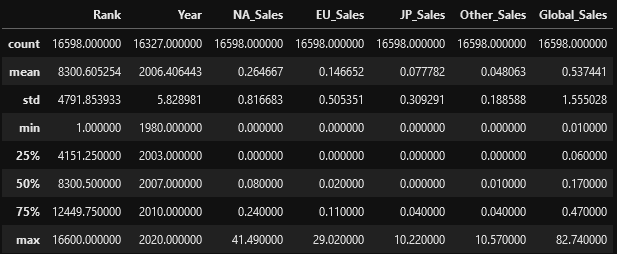 - ```python # This function shows the rows and columns of NaN values. For example, df[179,3] = nan np.where(pd.isnull(df)) @@ -71,25 +66,16 @@ np.where(pd.isnull(df)) sns.catplot(x='Platform', y='Global_Sales', data=df, jitter=False).set_xticklabels(rotation=90) ``` -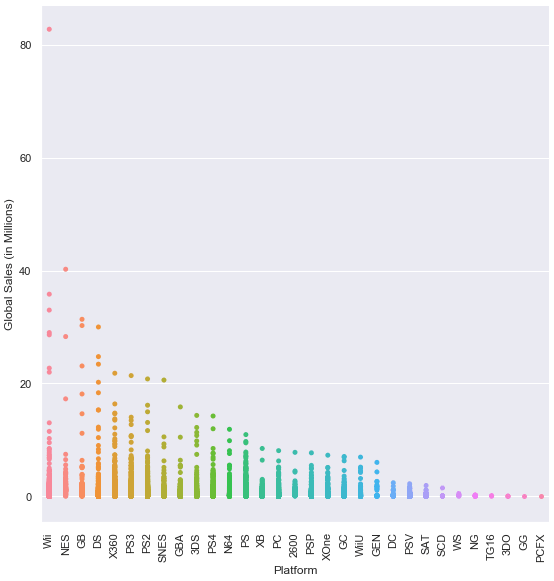 - ```python # This function plots the global sales by genre sns.catplot(x='Genre', y='Global_Sales', data=df, jitter=False).set_xticklabels(rotation=45) ``` -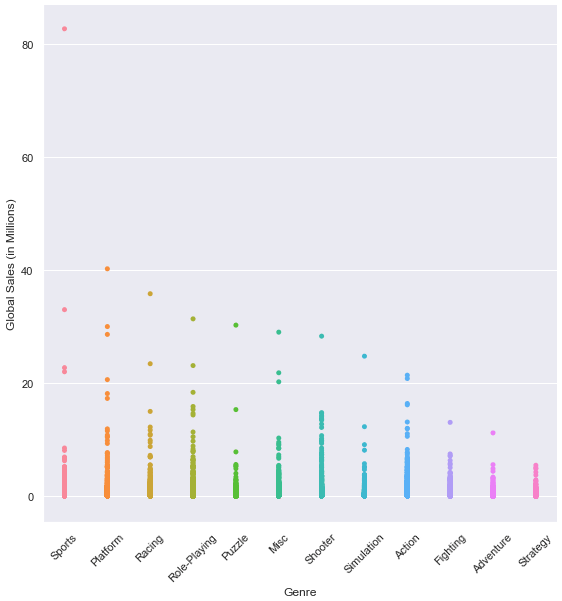 - ```python # This function plots the global sales by year sns.lmplot(x='Year', y='Global_Sales', data=df).set_xticklabels(rotation=45) ``` -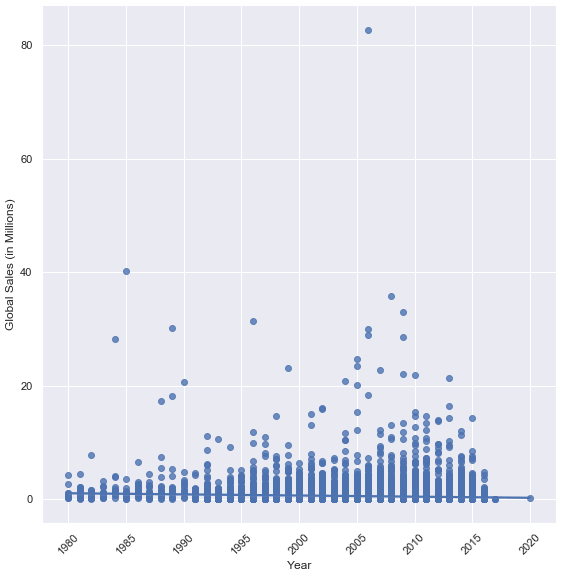 - ```python # This function plots four different lines to show sales from different regions. # The global sales plot line is commented-out, but can be included for comparison @@ -116,9 +102,6 @@ ax.legend() plt.show() ``` -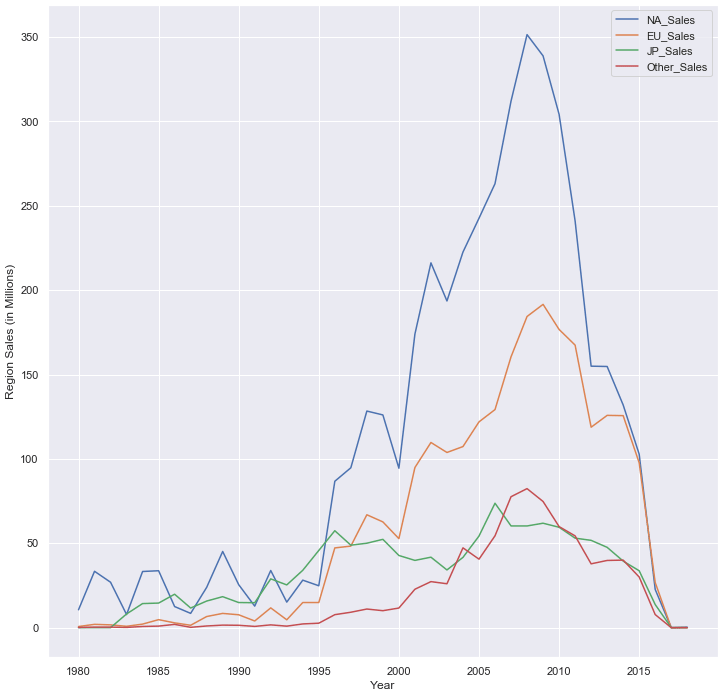 - ## Investigate Outliers ```python @@ -143,26 +126,17 @@ df3 = df[(df['Year'] == 2006)] df3.describe() ``` -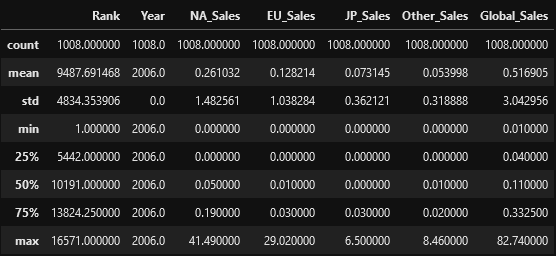 - ```python # Plot the results of the previous dataframe (games from 2006) - we can see the year's results were largely carried by Wii Sports sns.catplot(x="Genre", y="Global_Sales", data=df3, jitter=False).set_xticklabels(rotation=45) ``` -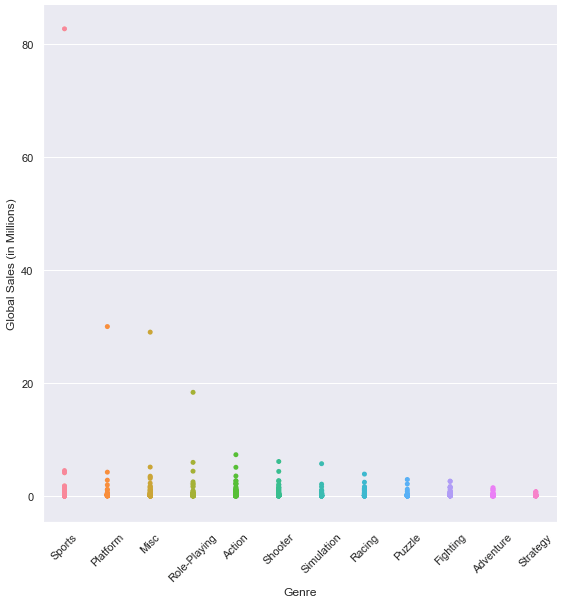 - ```python # We can see 4 outliers in the graph above, so let's get the top 5 games from that dataframe # The results below show that Nintendo had all top 5 games (3 on the Wii and 2 on the DS) df3.sort_values(by=['Global_Sales'], ascending=False).head(5) ``` -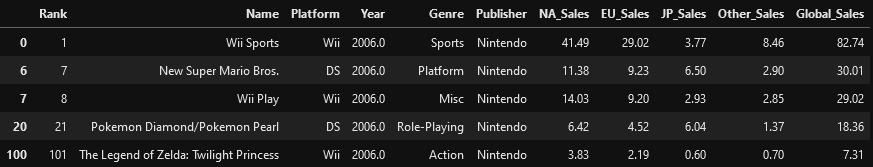 - # Discussion The purpose of exploring datasets is to ask questions, answer questions, and |