
diff options
Diffstat (limited to 'content/blog/2020-07-26-business-analysis.md')
| -rw-r--r-- | content/blog/2020-07-26-business-analysis.md | 21 |
1 files changed, 0 insertions, 21 deletions
diff --git a/content/blog/2020-07-26-business-analysis.md b/content/blog/2020-07-26-business-analysis.md index 20fb82d..292b113 100644 --- a/content/blog/2020-07-26-business-analysis.md +++ b/content/blog/2020-07-26-business-analysis.md @@ -51,9 +51,6 @@ map_LNK = folium.Map(location=[latitude, longitude], zoom_start=12) map_LNK ``` -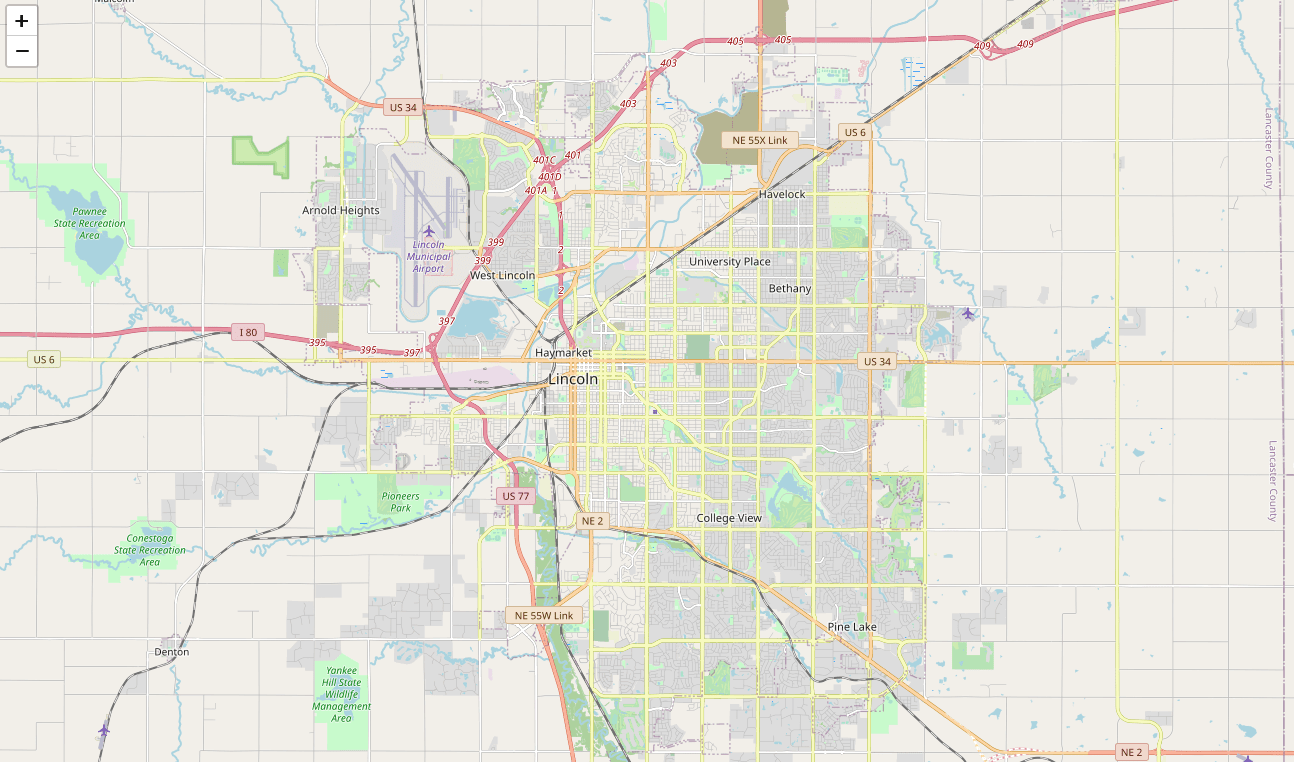 - Now that we have defined our city and created the map, we need to go get the business data. The Foursquare API will limit the results to 100 per API call, so we use our first API call below to determine the total results that Foursquare @@ -194,9 +191,6 @@ nearby_venues = nearby_venues.reset_index(drop=True) nearby_venues ``` -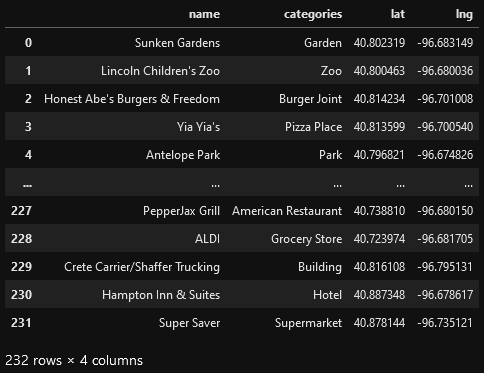 - # Visualize the Data We now have a complete, clean data set. The next step is to visualize this data @@ -221,9 +215,6 @@ for lat, lng, name, categories in zip(nearby_venues['lat'], nearby_venues['lng'] map_LNK ``` -\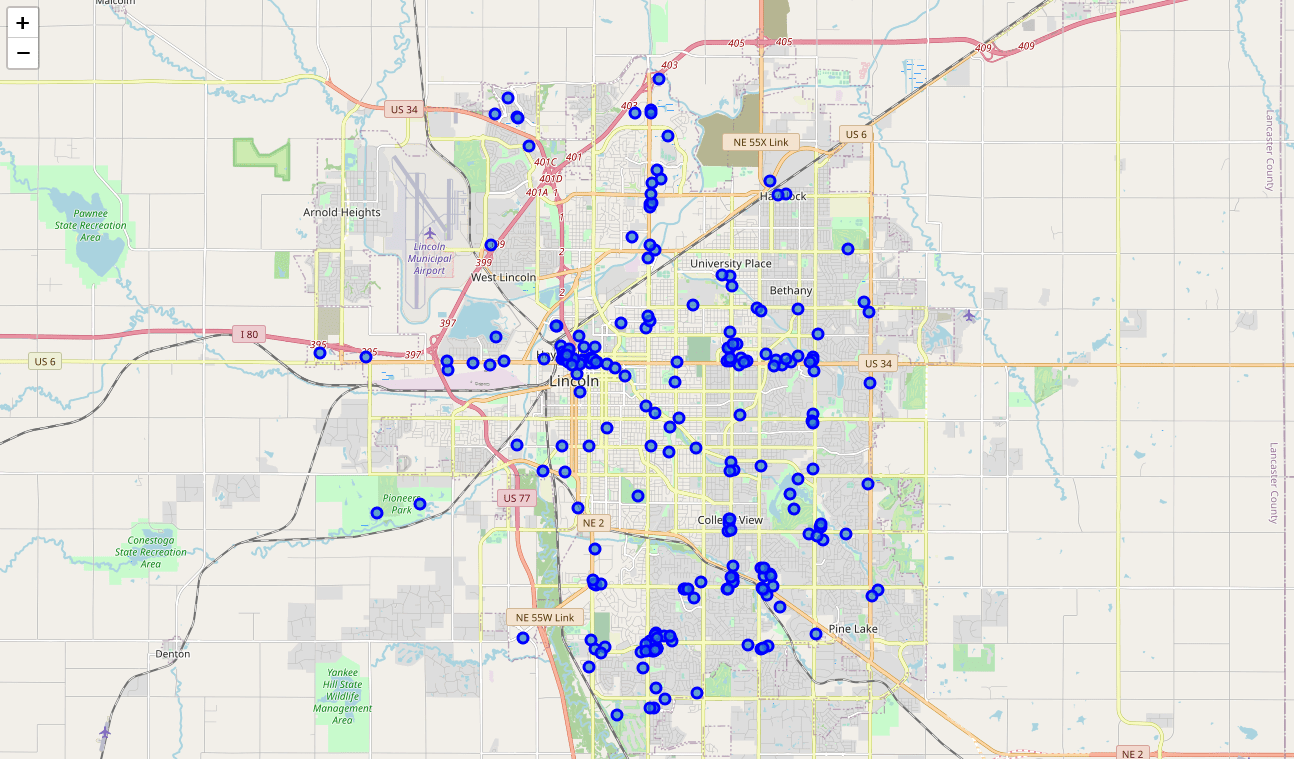 - # Clustering: _k-means_ To cluster the data, we will be using the _k-means_ algorithm. This algorithm is @@ -310,9 +301,6 @@ for lat, lng, name, categories, cluster in zip(nearby_venues['lat'], nearby_venu map_clusters ``` -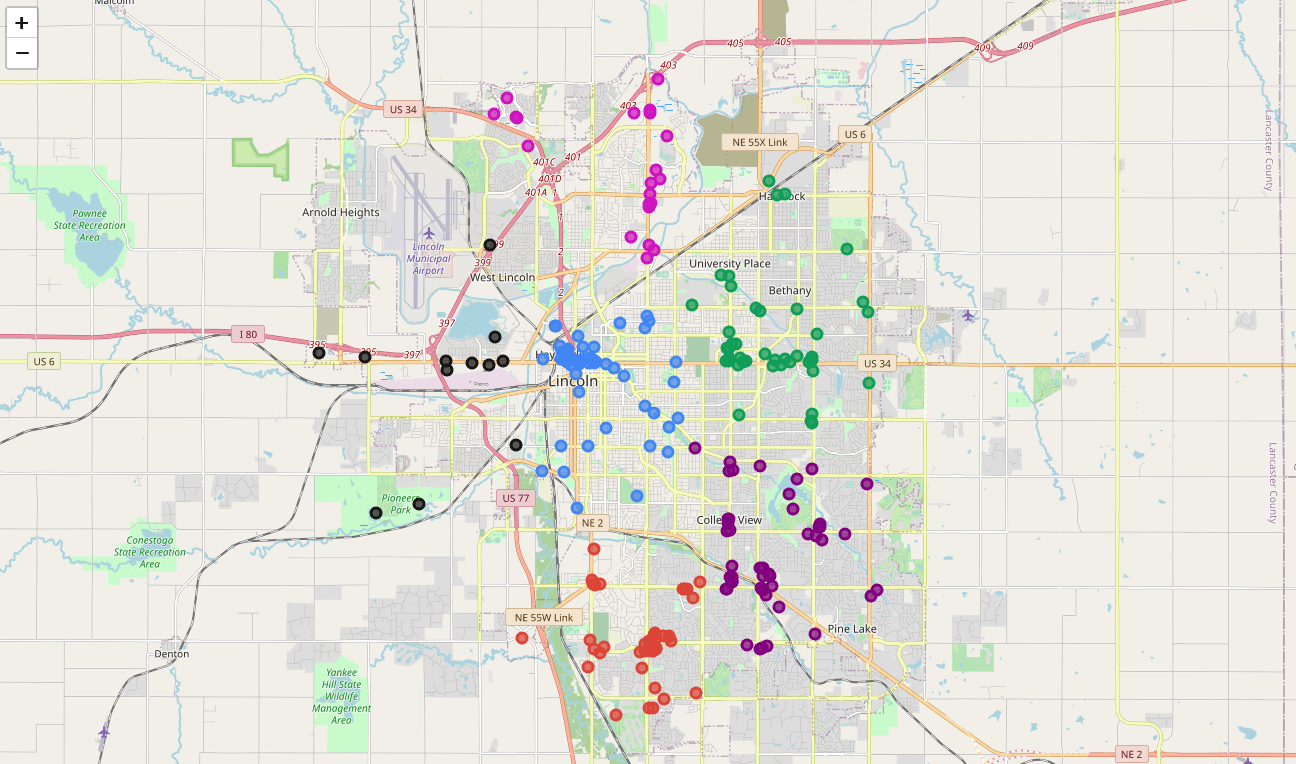 - # Investigate Clusters Now that we have figured out our clusters, let's do a little more analysis to @@ -330,9 +318,6 @@ for x in range(0,6): print("---") ``` -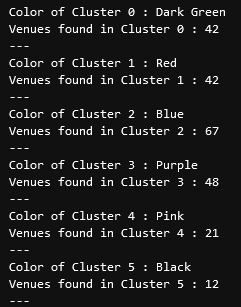 - Our last piece of analysis is to summarize the categories of businesses within each cluster. With these results, we can clearly see that restaurants, coffee shops, and grocery stores are the most popular. @@ -359,12 +344,6 @@ with pd.option_context('display.max_rows', None, 'display.max_columns', None): print("\n\n", "Cluster 5:", "\n", cluster5_grouped.loc[cluster5_grouped['Cluster Labels'] > 1]) ``` -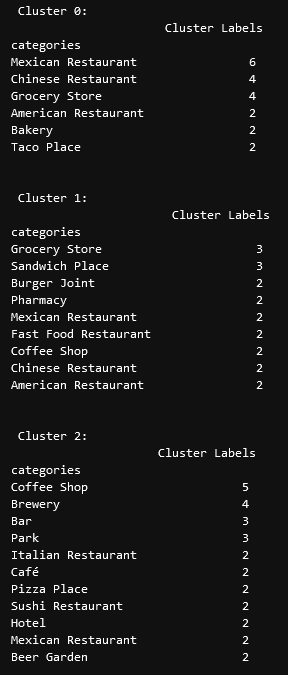 - -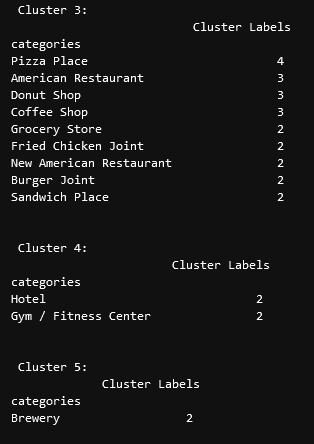 - # Discussion In this project, we gathered location data for Lincoln, Nebraska, USA and |