
diff options
Diffstat (limited to 'content/blog/2024-01-26-audit-dashboard.md')
| -rw-r--r-- | content/blog/2024-01-26-audit-dashboard.md | 188 |
1 files changed, 188 insertions, 0 deletions
diff --git a/content/blog/2024-01-26-audit-dashboard.md b/content/blog/2024-01-26-audit-dashboard.md new file mode 100644 index 0000000..5a40f51 --- /dev/null +++ b/content/blog/2024-01-26-audit-dashboard.md @@ -0,0 +1,188 @@ ++++ +date = 2024-01-26 +title = "Building an Audit Status Dashboard" +description = "" +draft = false ++++ + +Alteryx and Power BI are powerful tools that can help turn your +old-school audit trackers into interactive tools that provide useful +insights and potential action plans. + +With these tools, we are going to build the following dashboard: + +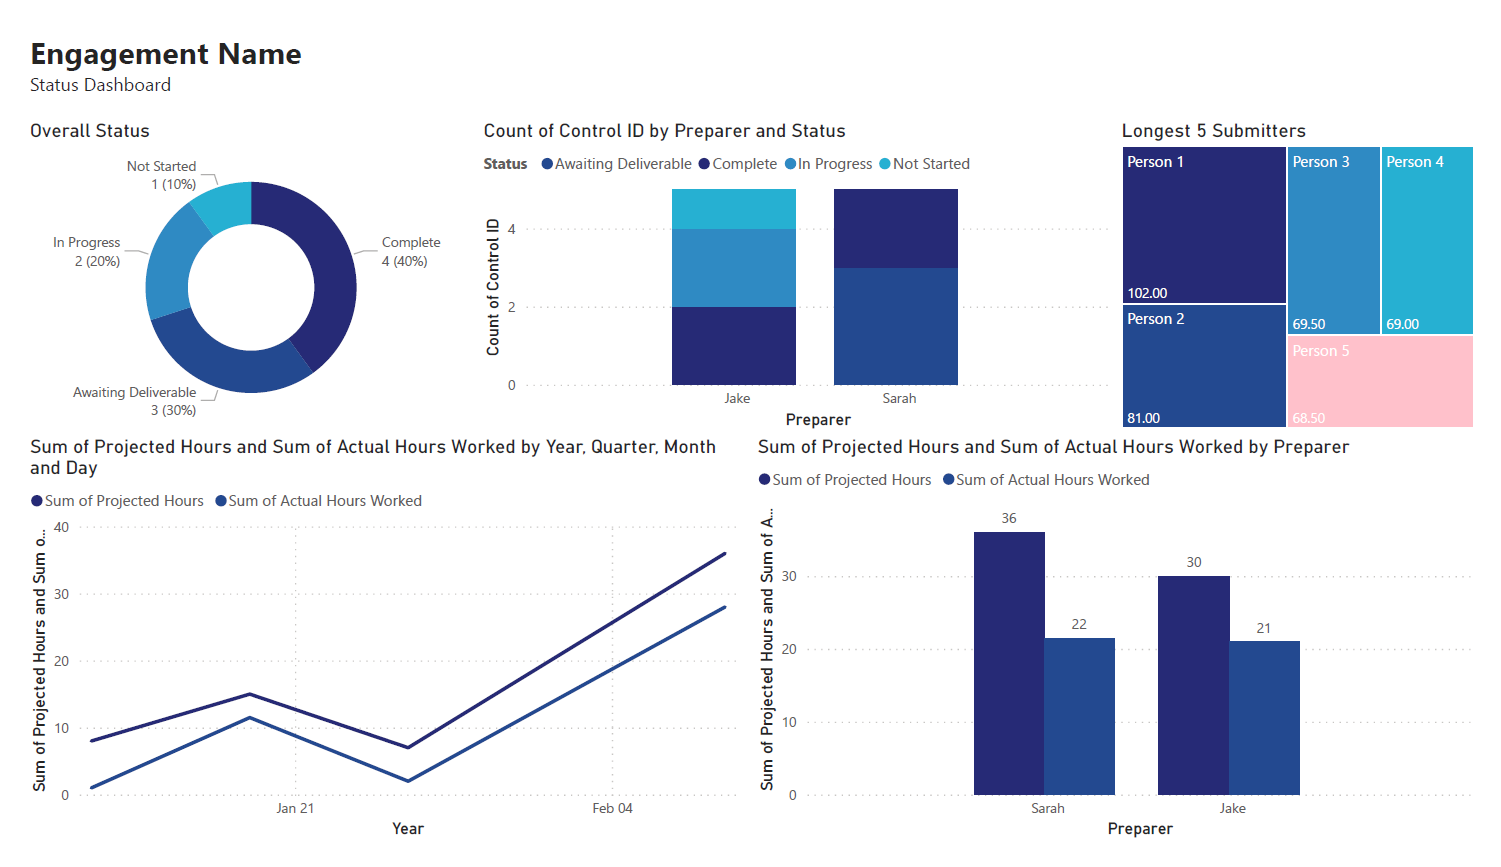 +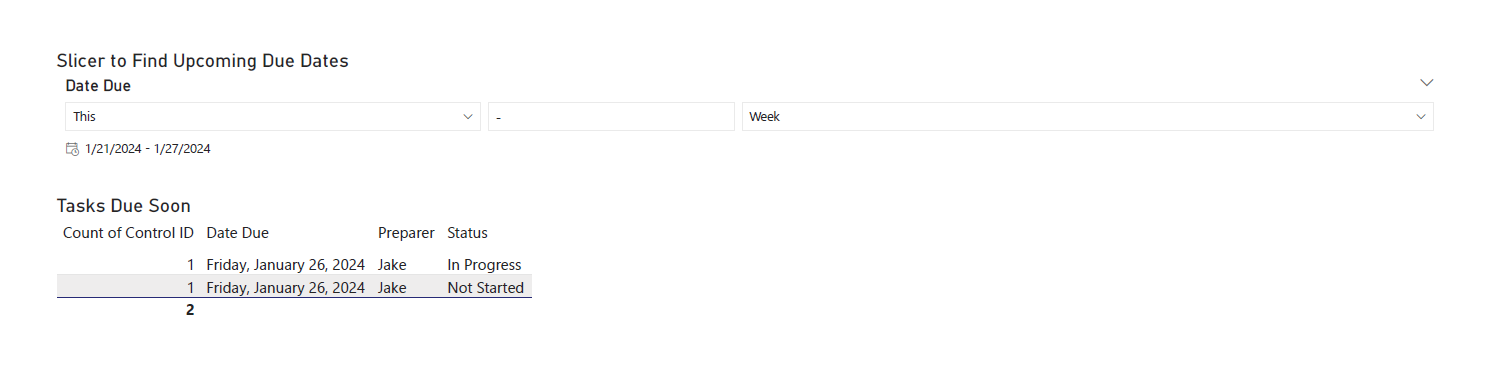 + +# Requirements + +This project assumes the following: + +- You have access to Alteryx Designer and Power BI Desktop. + - If you only have Power BI Desktop, you may need to perform some + analysis in Power BI instead of Alteryx. +- Your data is in a format that can be imported into Alteryx and/or + Power BI. +- You have a basic understanding of data types and visualization. + +# Alteryx: Data Preparation & Analysis + +## Import Data + +With Alteryx, importing data is easy with the use of the +`Input Data` tool. Simply drag this tool onto the canvas from +the `In/Out` tab in the Ribbon to create it as a node. + +You can choose the File Format manually or simply connect to your +file/database and let Alteryx determine the format for you. For this +example, we will be importing an Excel file and changing the +`Start Data Import on Line` variable to `2`. + + + +## Transform Data + +Next, let\'s replace null data and remove whitespace to clean up our +data. We can do this with the `Data Cleansing` tool in the +`Preparation` tab in the Ribbon. + +Ensure that the following options are enabled: + +- Replace Nulls + - Replace with Blanks (String Fields) + - Replace with 0 (Numeric Fields) +- Remove Unwanted Characters + - Leading and Trailing Whitespace + +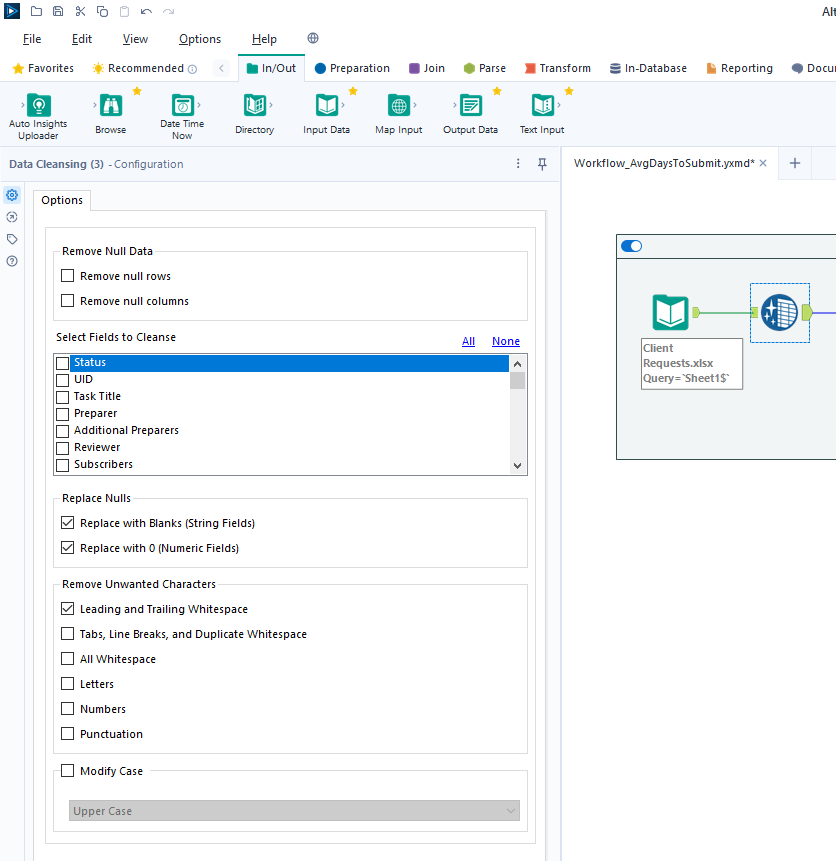 + +For our next step, we will transform the date fields from strings to +datetime format. Add a `Datetime` tool for each field you +want to transform - in the example below, I am using the tool twice for +the \"Started On\" and \"Submitted On\" fields. + +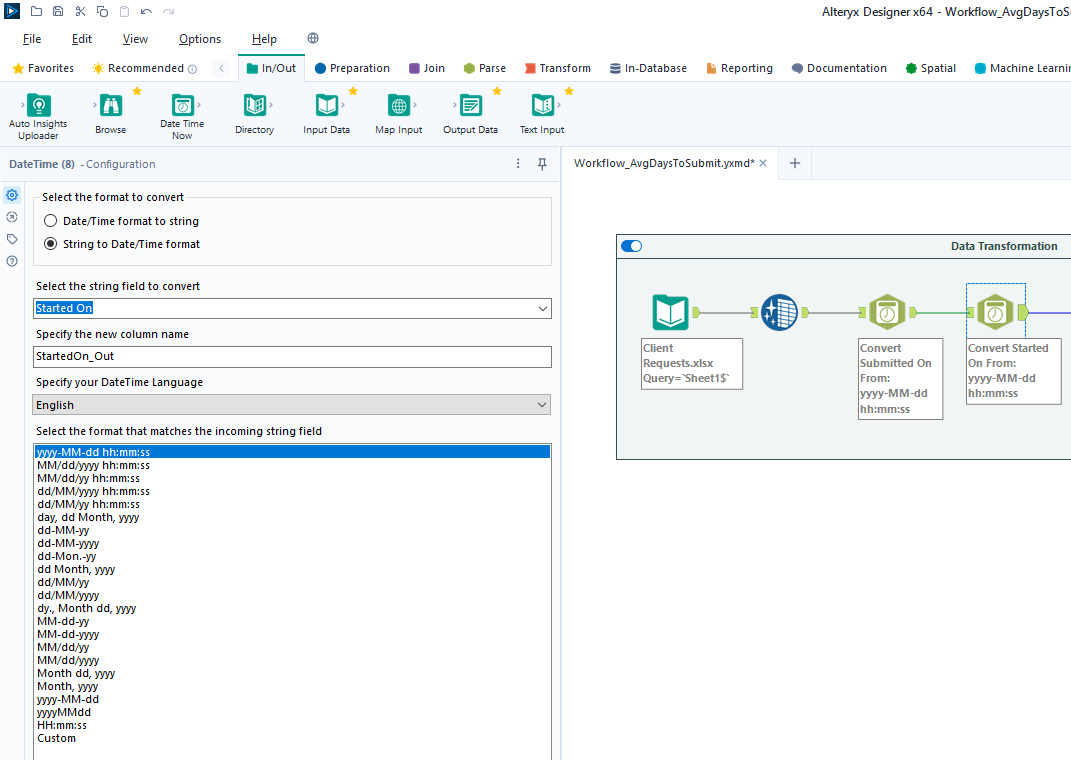 + +Now that the dates are in the correct format, let\'s perform a +calculation based on those fields. Start by adding a `Filter` +tool, naming a new Output Column, and pasting the formula below into it +(the two fields used in this formula must match the output of the +`Datetime` tools above): + +``` txt +DateTimeDiff([SubmittedOn_Out],[StartedOn_Out], "days") +``` + +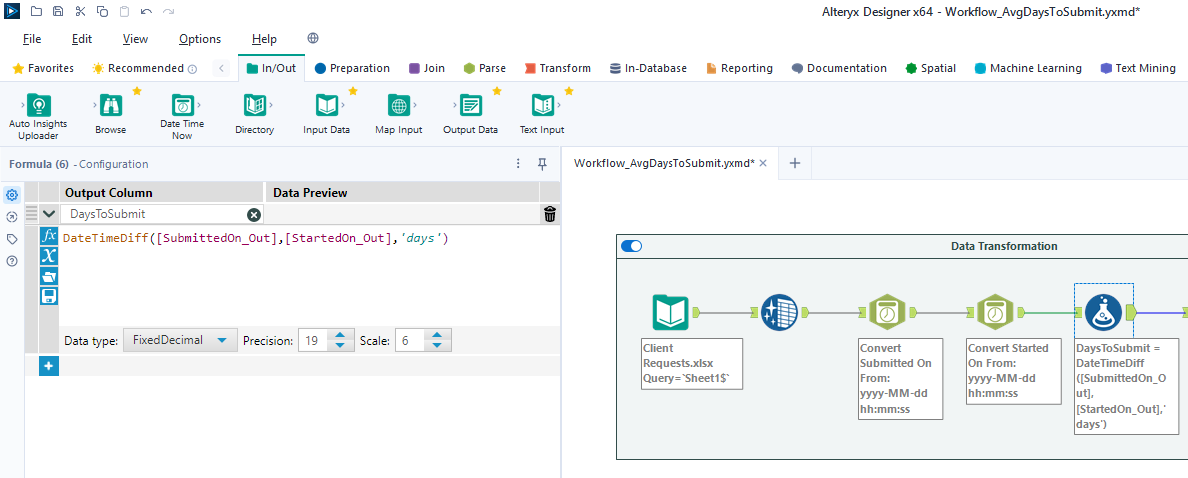 + +## Export Data + +Finalize the process by exporting the transformed data set to a new +file, for use in the following visualization step. + +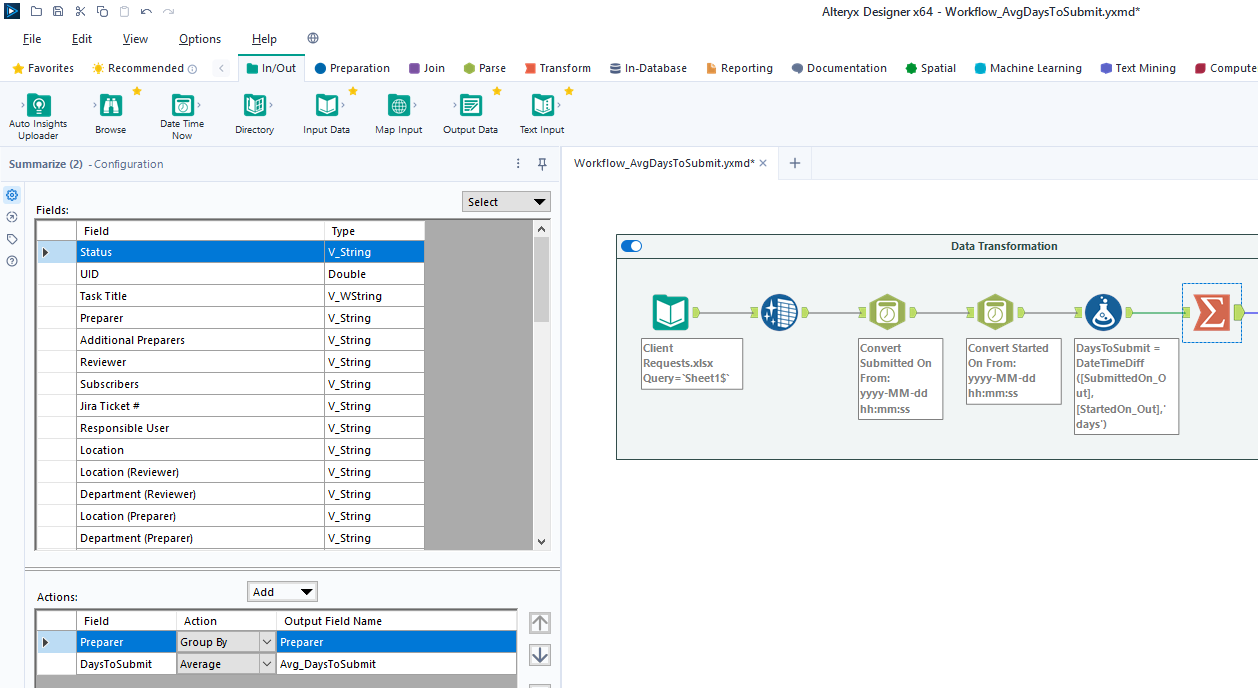 + +# Power BI: Data Visualization + +## Import Data + +To start, open the Power BI Desktop application. Upon first use, Power +BI will ask if you want to open an existing dashboard or import new +data. + +As we are creating our first dashboard, let\'s import our data. In my +example below, I\'m importing data from the \"Tracker\" sheet of the +Excel file I\'m using for this project. + +During this process, I also imported the export from the Alteryx +workflow above. Therefore, we have two different files available for use +in our dashboard. + +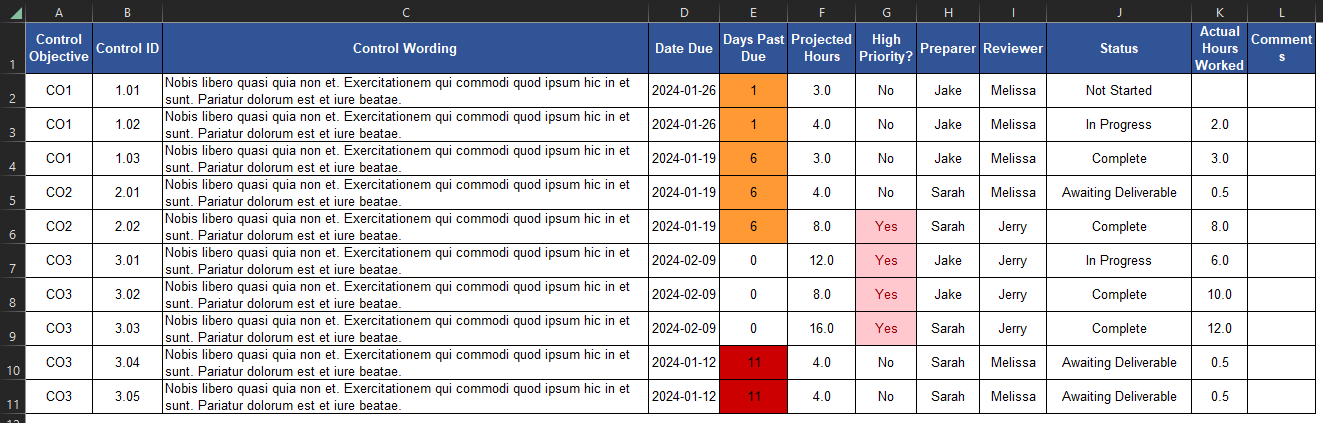 + +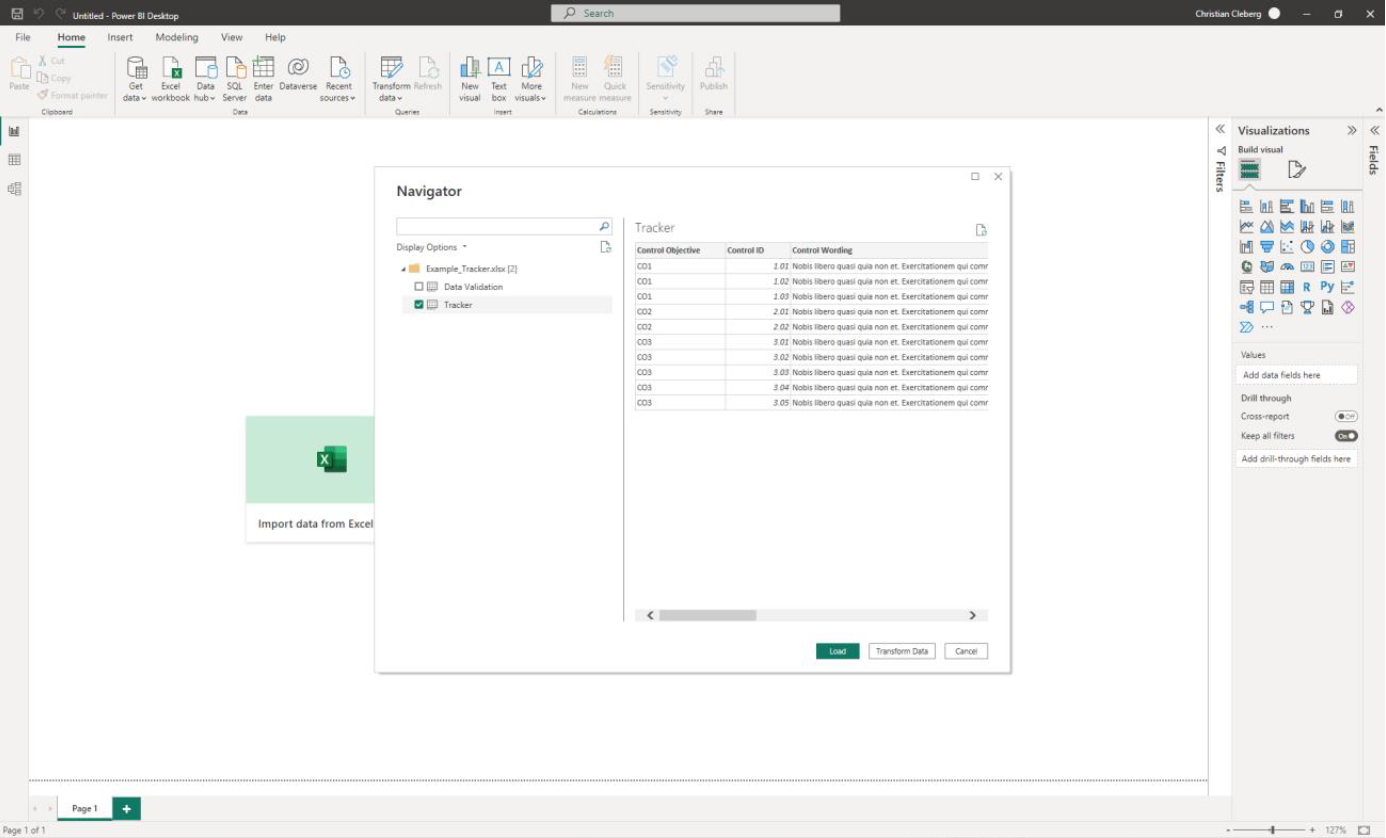 + +## Add Visuals + +To create the dashboard below, you will need to follow the list +instructions below and format as needed: + + + + +Instructions to create the visuals above: + +- `Text Box`: Explain the name and purpose of the + dashboard. You can also add images and logos at the top of the + dashboard. +- `Donut Chart`: Overall status of the project. + - `Legend`: Status + - `Values`: Count of Status +- `Stacked Column Chart`: Task count by assignee. + - `X-axis`: Preparer + - `Y-axis`: Count of Control ID + - `Legend`: Status +- `Treemap`: Top N client submitters by average days to + submit. + - `Details`: Preparer + - `Values`: Sum of Avg~DaysToSubmit~ +- `Line Chart`: Projected vs. actual hours over time. +- `Clustered Bar Chart`: Projected vs. actual hours per + person. +- `Slicer & Table` - Upcoming due dates. + - `Slicer`: + - `Values`: Date Due + - `Table`: + - `Columns`: Count of Control ID, Date Due, + Preparer, Status + +## Format the Dashboard + +You can choose a theme in the View tab of the Ribbon. You can even +browse for custom JSON files that define themes, such as ones found +online or custom ones created by your organization. + +For each visual, you can click the `Format` button in the +`Visualizations` side pane and explore the options. You can +custom options such as: + +- Visual + - Legend + - Colors + - Data labels + - Category labels +- General + - Properties + - Title + - Effects + - Header icons + - Tooltips + - Alt text + +You can always look online for inspiration when trying to decide how +best to organize and style your dashboard. + +# Sharing the Results + +Generally, you have a few different options for sharing your dashboards +with others: + +1. Export the dashboard as a PDF in the file menu of Power BI. This + will export all tabs and visuals as they are set when the export + button is pressed. You will lose all interactivity with this option. +2. Send the full Power BI file to those you wish to share the + dashboard. This will retain all settings and interactivity. However, + you will also need to send the source files if they need to refresh + the dashboard and you will need to re-send the files if you make + updates. +3. Store the dashboard in a synced location, such as a shared drive or + Microsoft Teams. Depending on how a user configures their local + Windows paths, the data source paths may not be compatible for all + users with such a setup. |