
diff options
Diffstat (limited to 'content/blog/2024-01-27-tableau-dashboard.md')
| -rw-r--r-- | content/blog/2024-01-27-tableau-dashboard.md | 166 |
1 files changed, 166 insertions, 0 deletions
diff --git a/content/blog/2024-01-27-tableau-dashboard.md b/content/blog/2024-01-27-tableau-dashboard.md new file mode 100644 index 0000000..4761676 --- /dev/null +++ b/content/blog/2024-01-27-tableau-dashboard.md @@ -0,0 +1,166 @@ ++++ +date = 2024-01-27 +title = "Data Visualization: Mapping Omaha Crime Data with Tableau" +description = "" +draft = false ++++ + +In this project, I am going to show you how to use Tableau Public for +free to create simple dashboards. + +I will be creating simple visuals from an Omaha crime data set and +combining them to create the dashboard below. You can view this +dashboard interactively online here: [Omaha Crime Data (2015 - +2023)](https://public.tableau.com/app/profile/c.c7042/viz/OmahaCrimeData2015-2023/OmahaCrimeData2015-2023#1). + +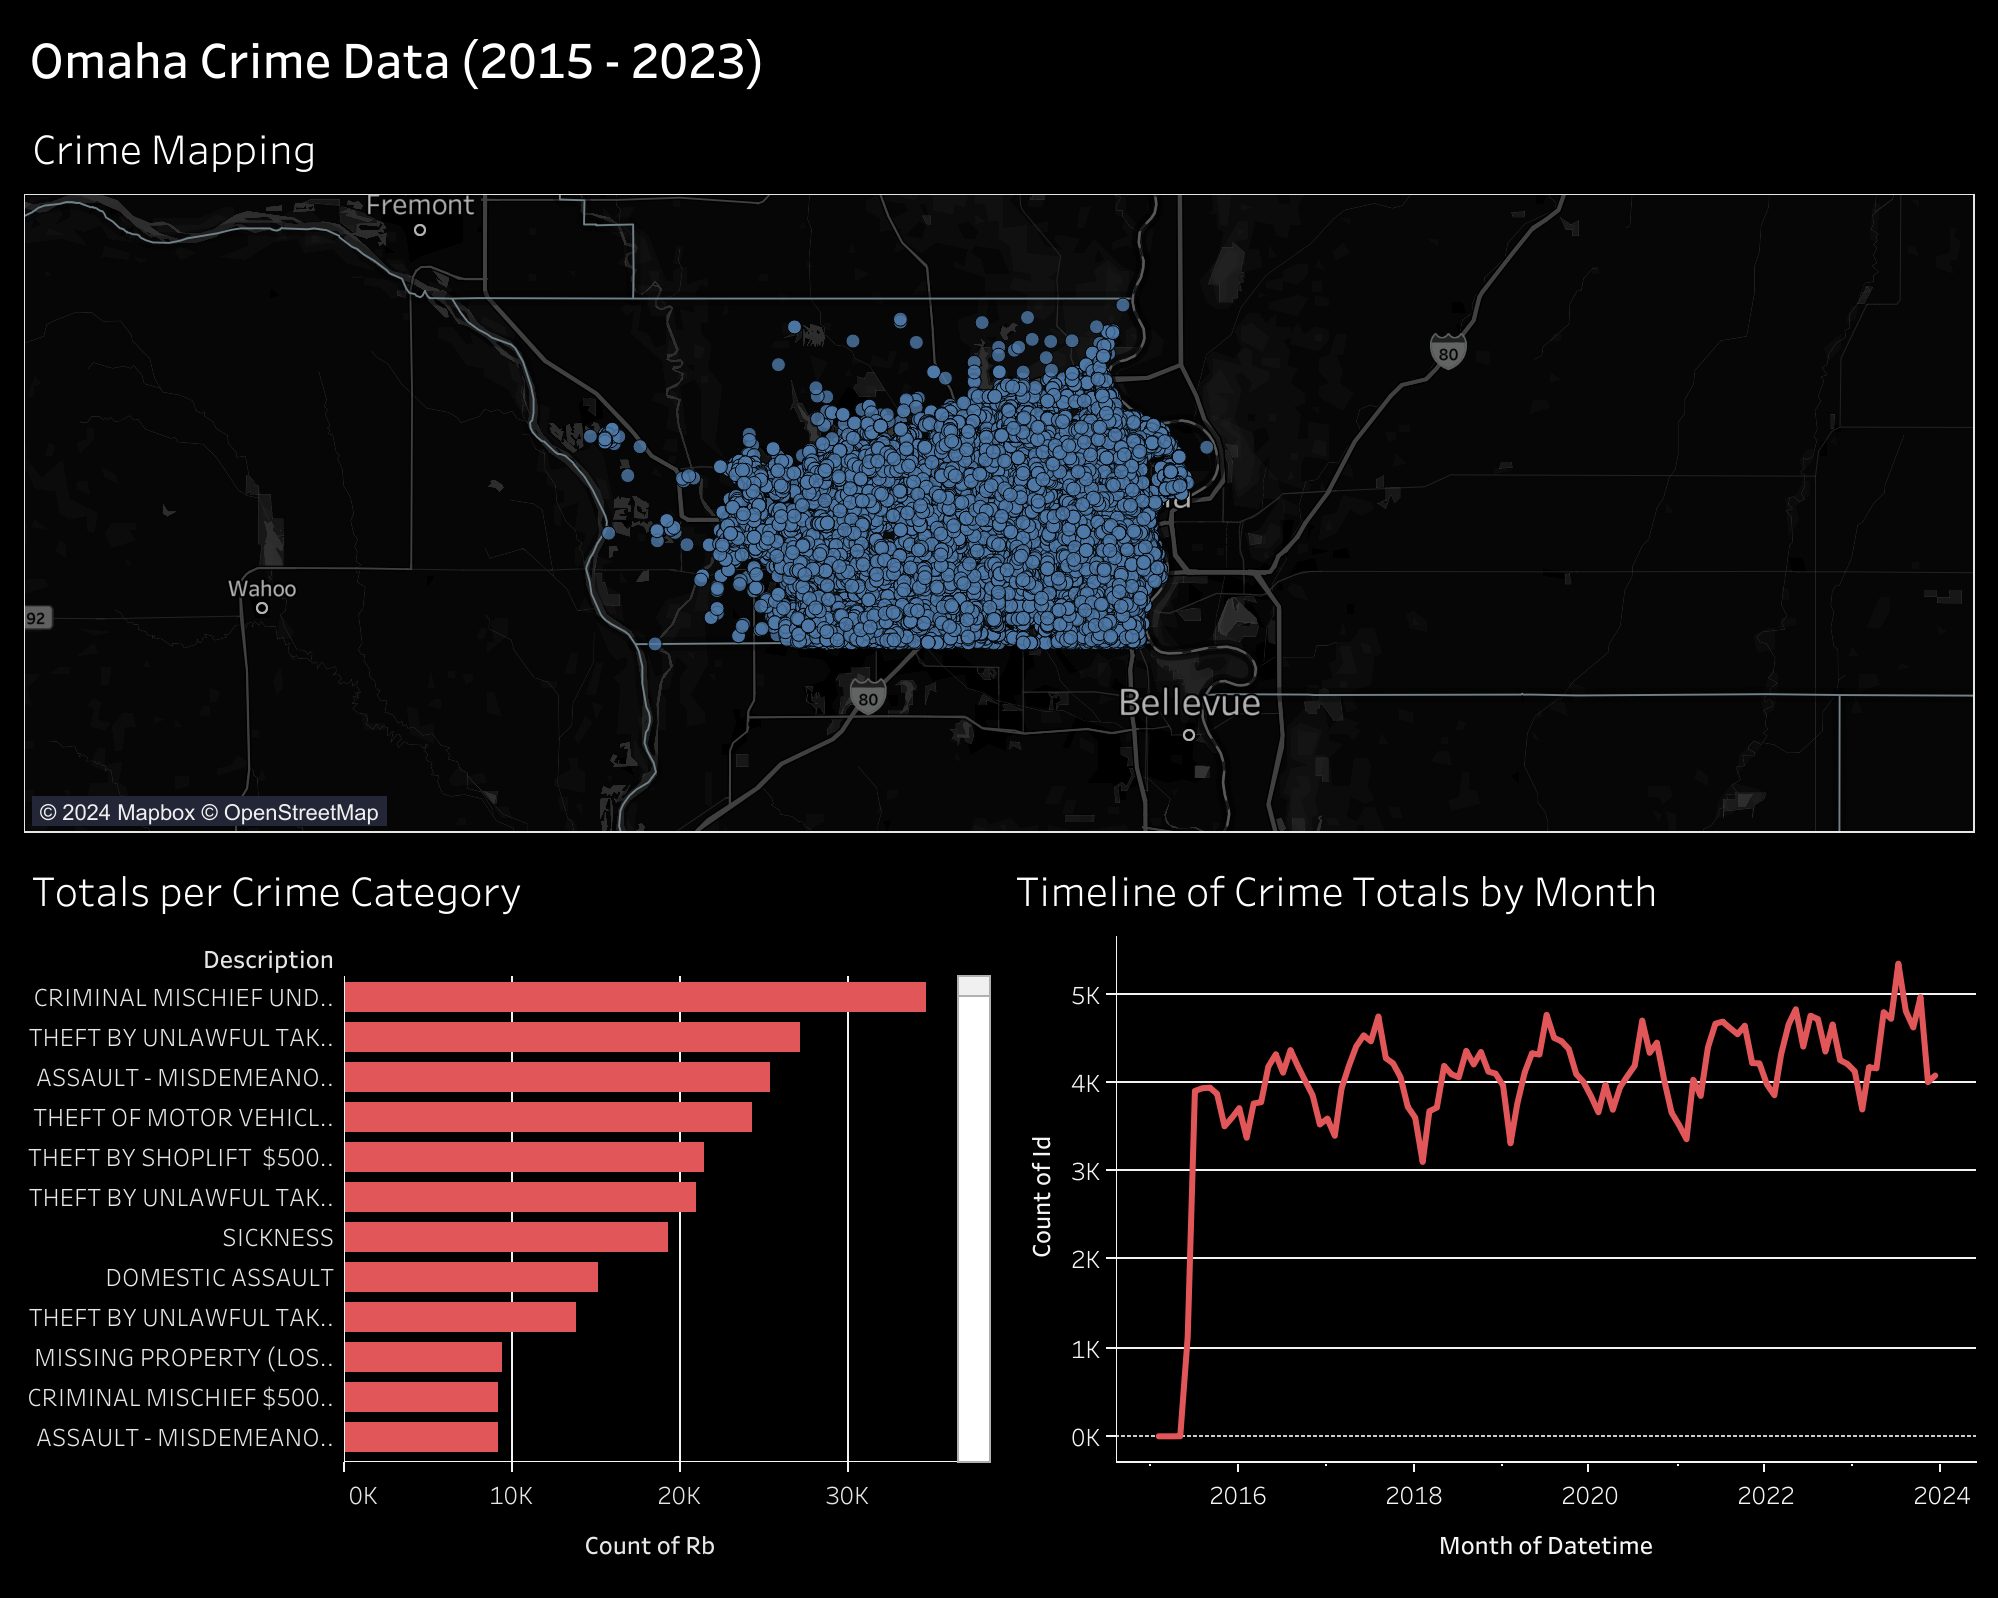 + +# Gather the Data + +You can download incident data from the Omaha Police Department on their +[Incident Data +Download](https://police.cityofomaha.org/crime-information/incident-data-download) +page. They currently have files for the years 2015 through 2023. + +Each file will be downloaded as a CSV file, approximately 3 MB - 8 MB. + +# Clean and Transform the Data + +I have used Python to combine the files into a single CSV file, as well +as adding a custom `datetime` column. You could do this step +in any software you prefer, but I prefer Python as its free, easy to +use, and has a plethora of support resources online. + +Start by opening a terminal, navigating to your Downloads directory, and +creating a python script. + +```sh +cd ~/Downloads +nano data_processing.py +``` + +Within the Python script, paste the following: + +``` python +# Import modules +import pandas as pd +import glob +import os + +# Import the data +path = r"~/Downloads/*.csv" +files = glob.glob(path) + +list = [] + +for file in files: + df_tmp = pd.read_csv(file) + li.append(df_tmp) + +df = pd.concat(list, axis=0, ignore_index=True) + +# Create a combined datetime column +df["datetime"] = pd.to_datetime( + df["date"] + " " + df["time"], + format="%m/%d/%Y %H:%M:%S" +) +df.head() + +# Export the combined data +df.to_csv(r"~/Downloads/combined_incidents.csv") +``` + +Once pasted, save and close the file. You can execute the file like so: + +```sh +python3 data_processing.py +``` + +After this, you should have a combined data file that contains all +incidents between 2015 and 2023. Mine was approximately 55 MB. + +# Tableau Public + +[Tableau Public](https://public.tableau.com/) is a free-to-use web +application that allows you to create visualizations by uploading data +sources. Note that there\'s no way to keep the data and visualizations +private, so don\'t upload anything private. + +After creating an account, you can click the `Create` \> +`Web Authoring` link to create your first visualization. + +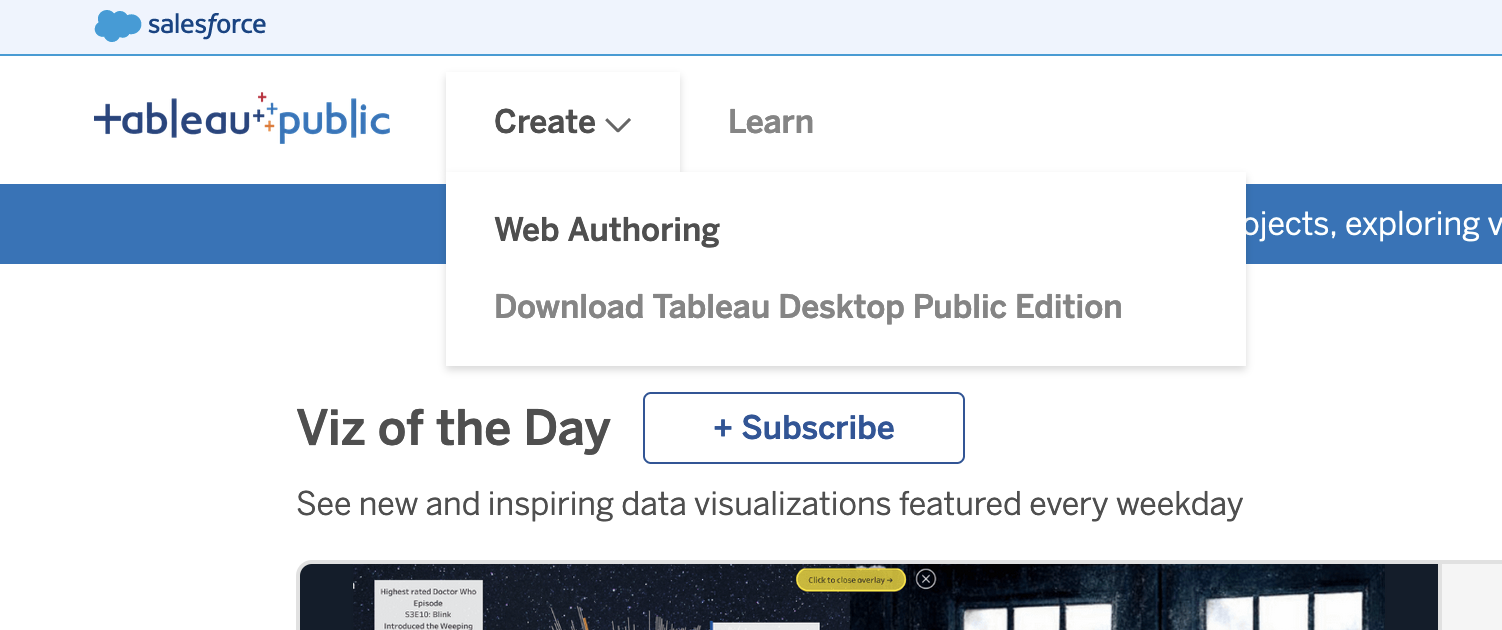 + +## Upload the Data + +Once you\'ve opened your first project, Tableau will ask you to connect +to your data. For this project, click the +`Upload from computer` button and select the CSV file +previously combined in the step above. + +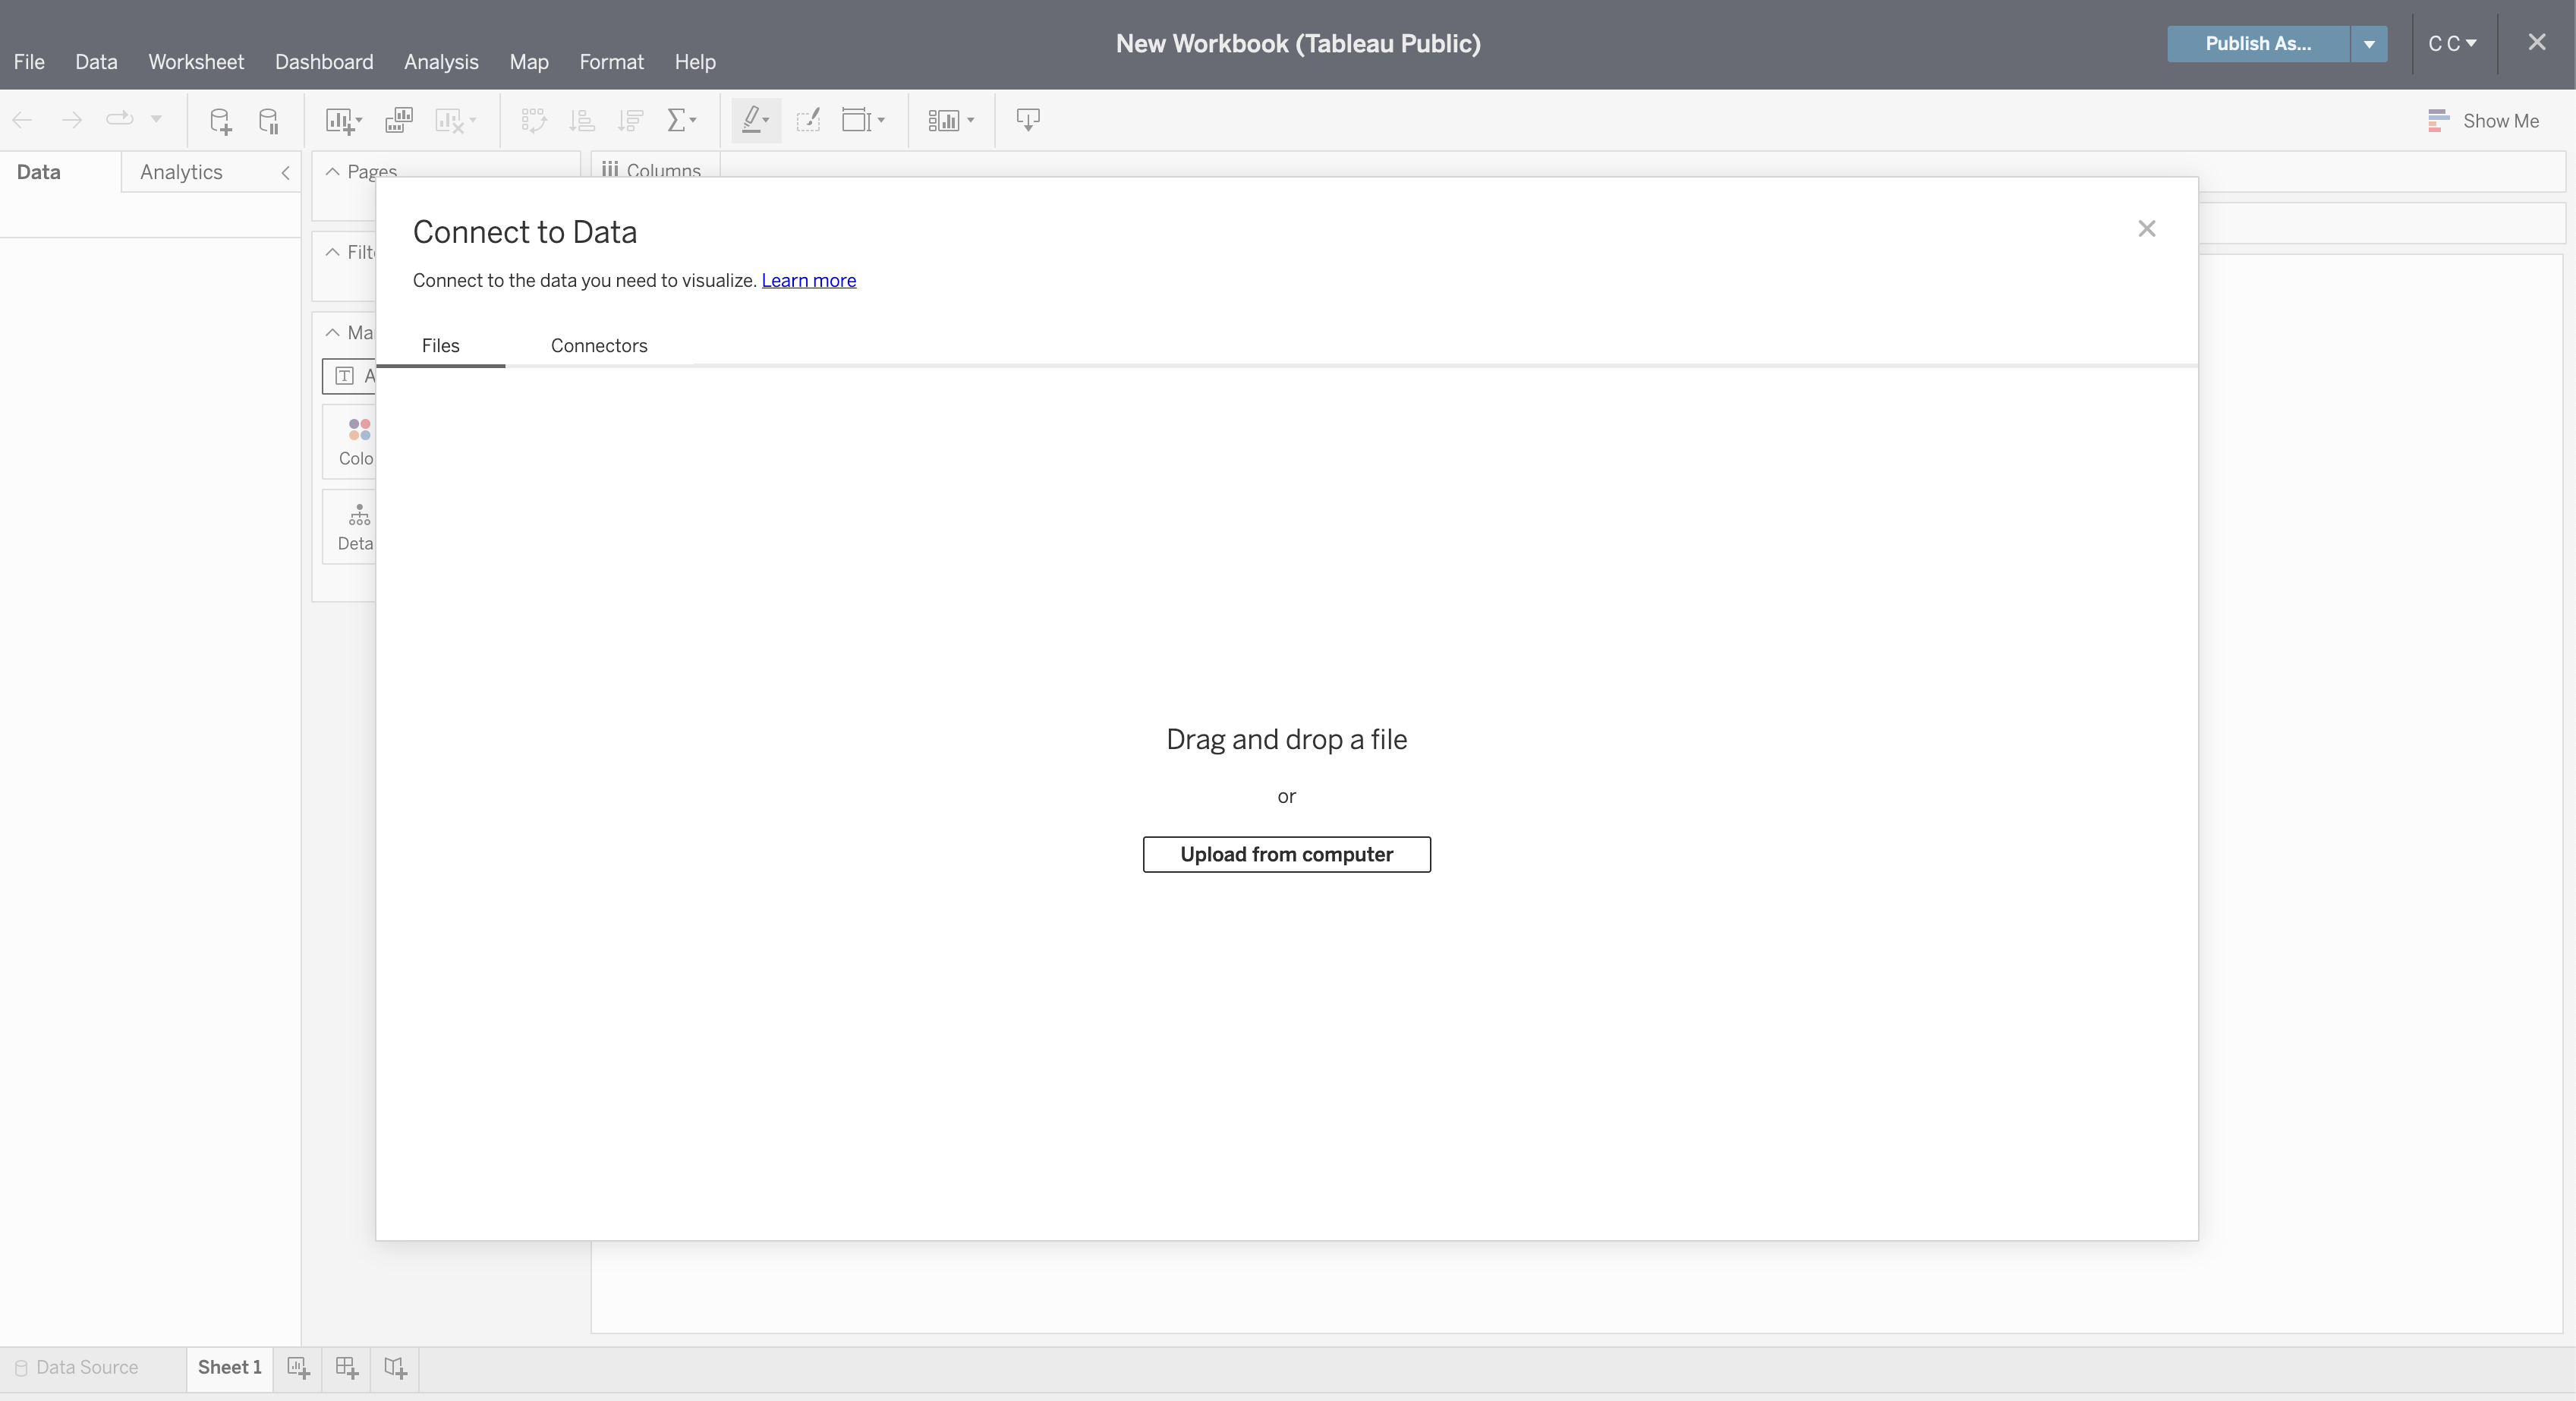 + +Once connected, you can refresh the preview of the data with the +`Refresh Data Source` button in the toolbar. + +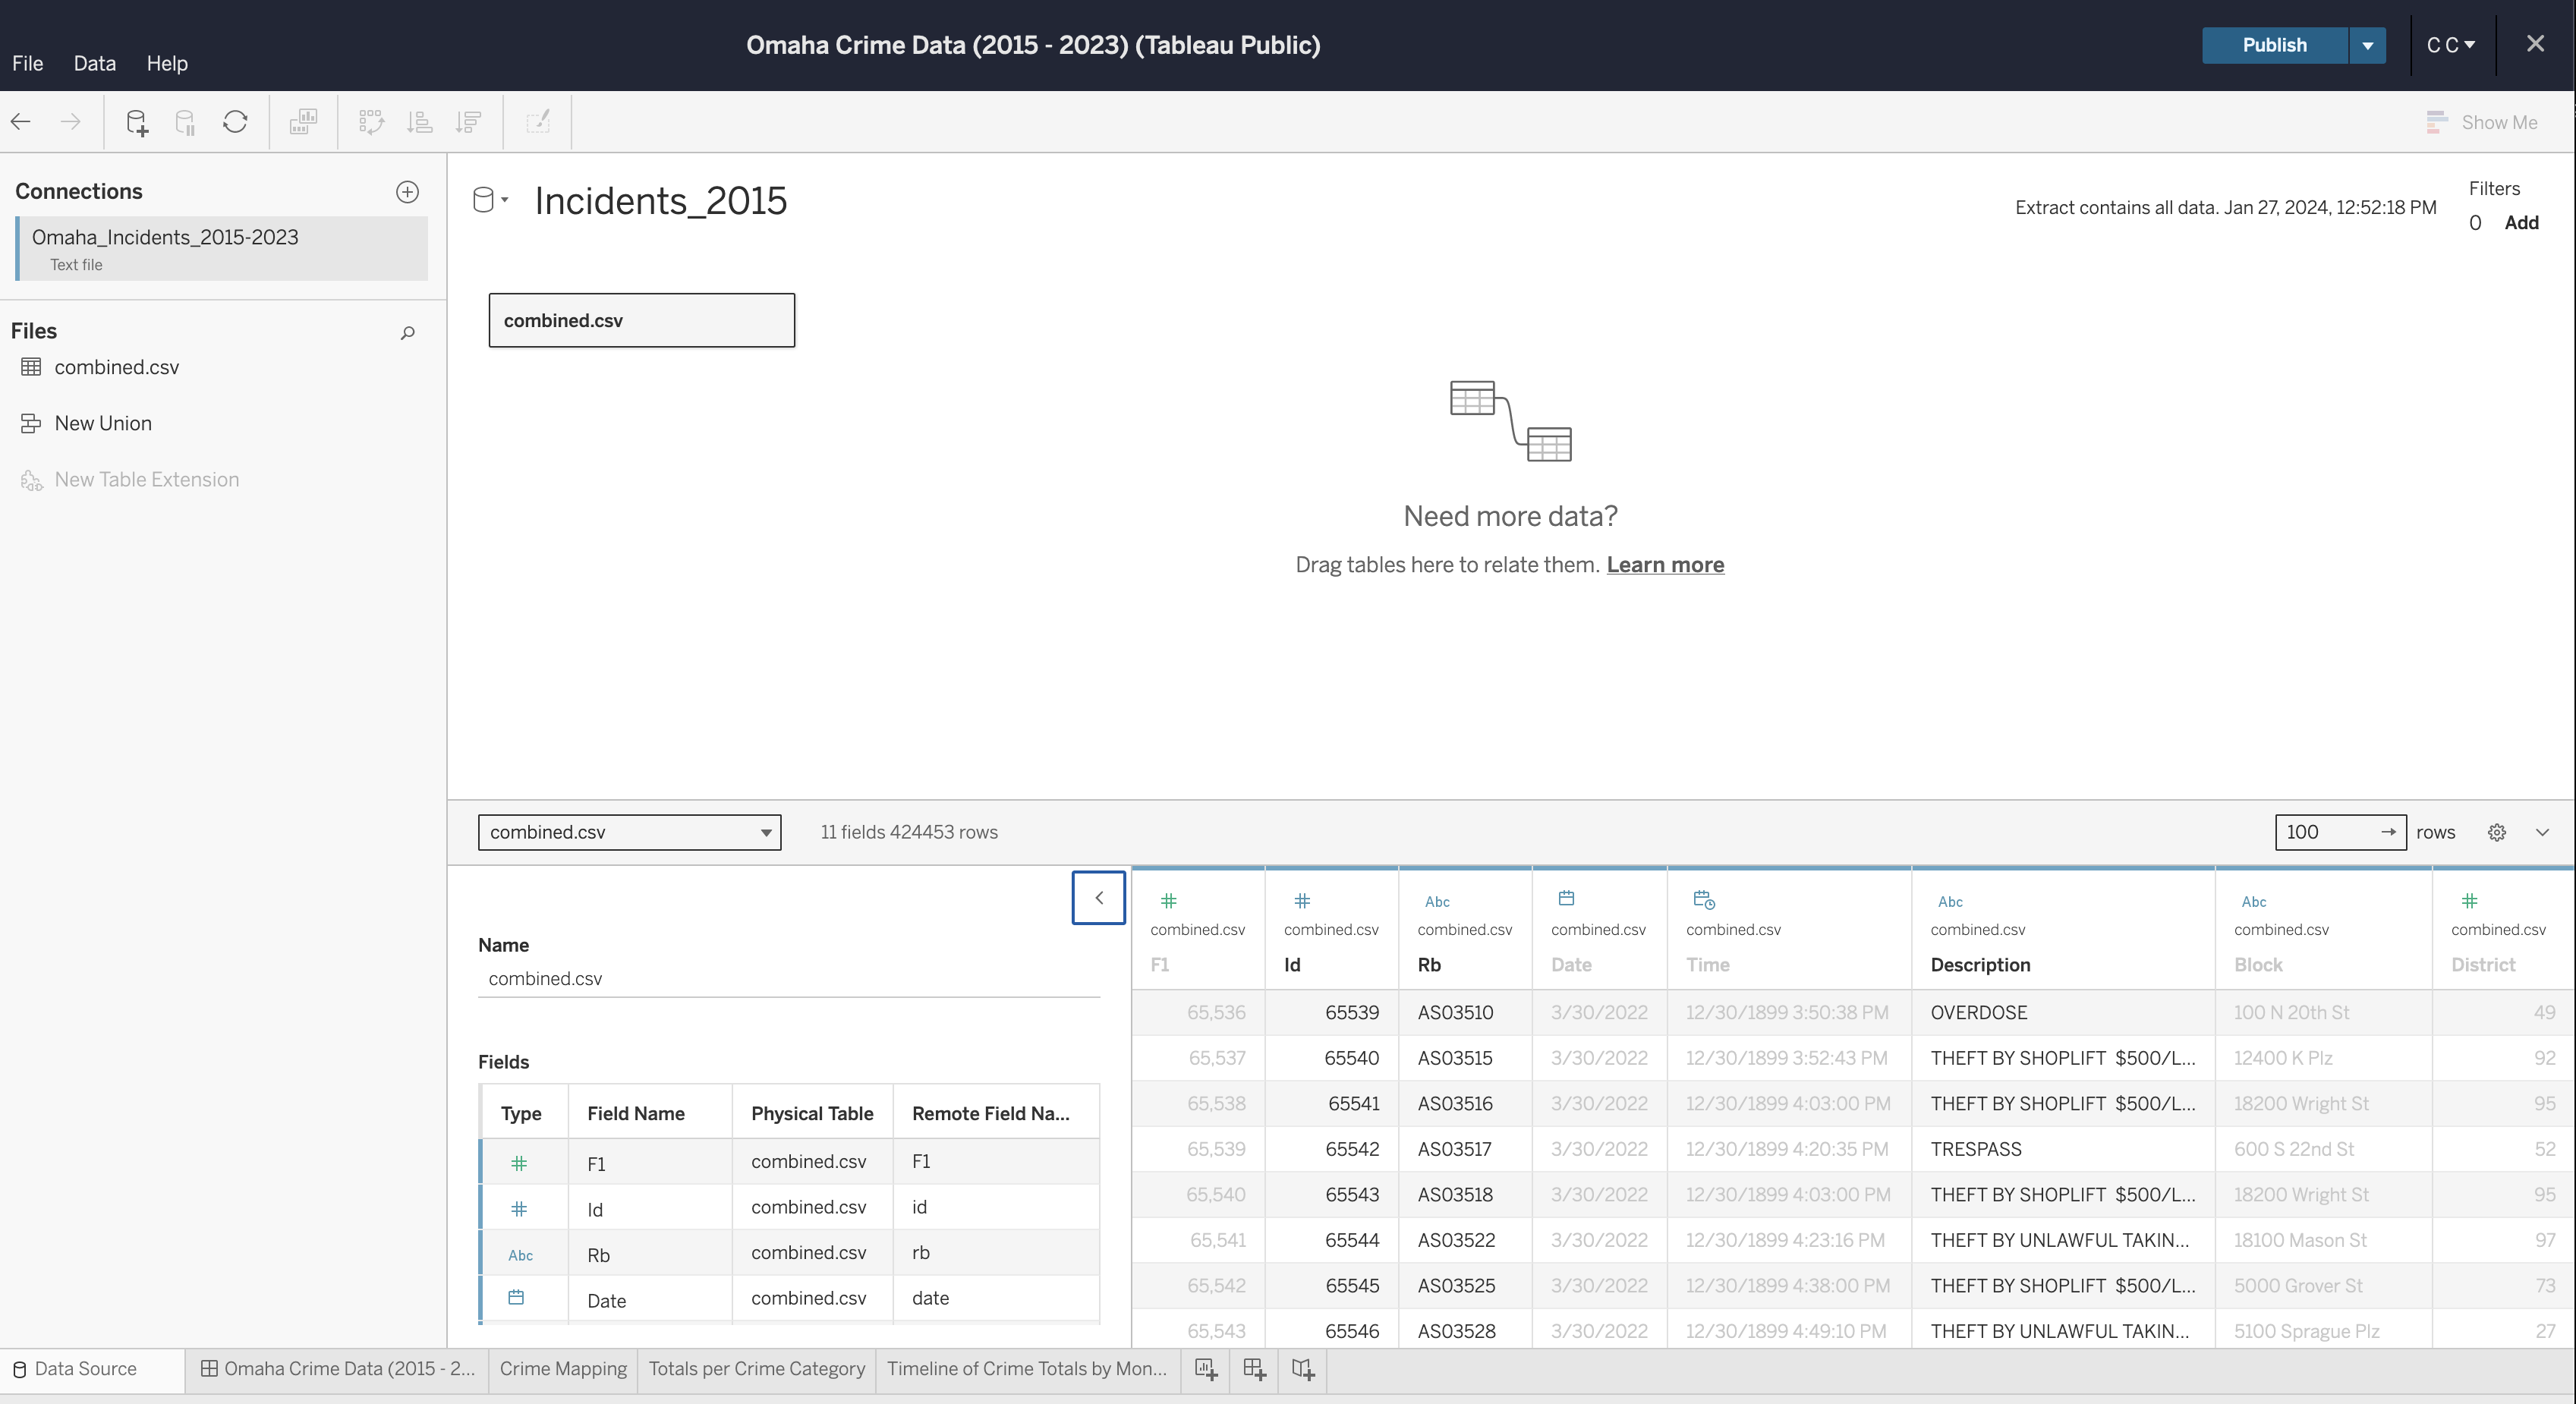 + +If you need to edit any of the data types, column names, etc., you can +do so now. Once complete, generate an extract so that you can start +creating visualizations. + +## Create Visualizations + +To start, create a worksheet in the toolbar at the bottom of the screen. + +Within this screen, select a column from the `Data` side bar +on the left and drag it into the `Columns` or +`Rows` area of the canvas. + +See below for the map visualization. You can recreate this by adding the +following fields: + +- `Columns`: Lon +- `Rows`: Lat +- `Marks`: + - Description + - Datetime +- `Filters`: Datetime + +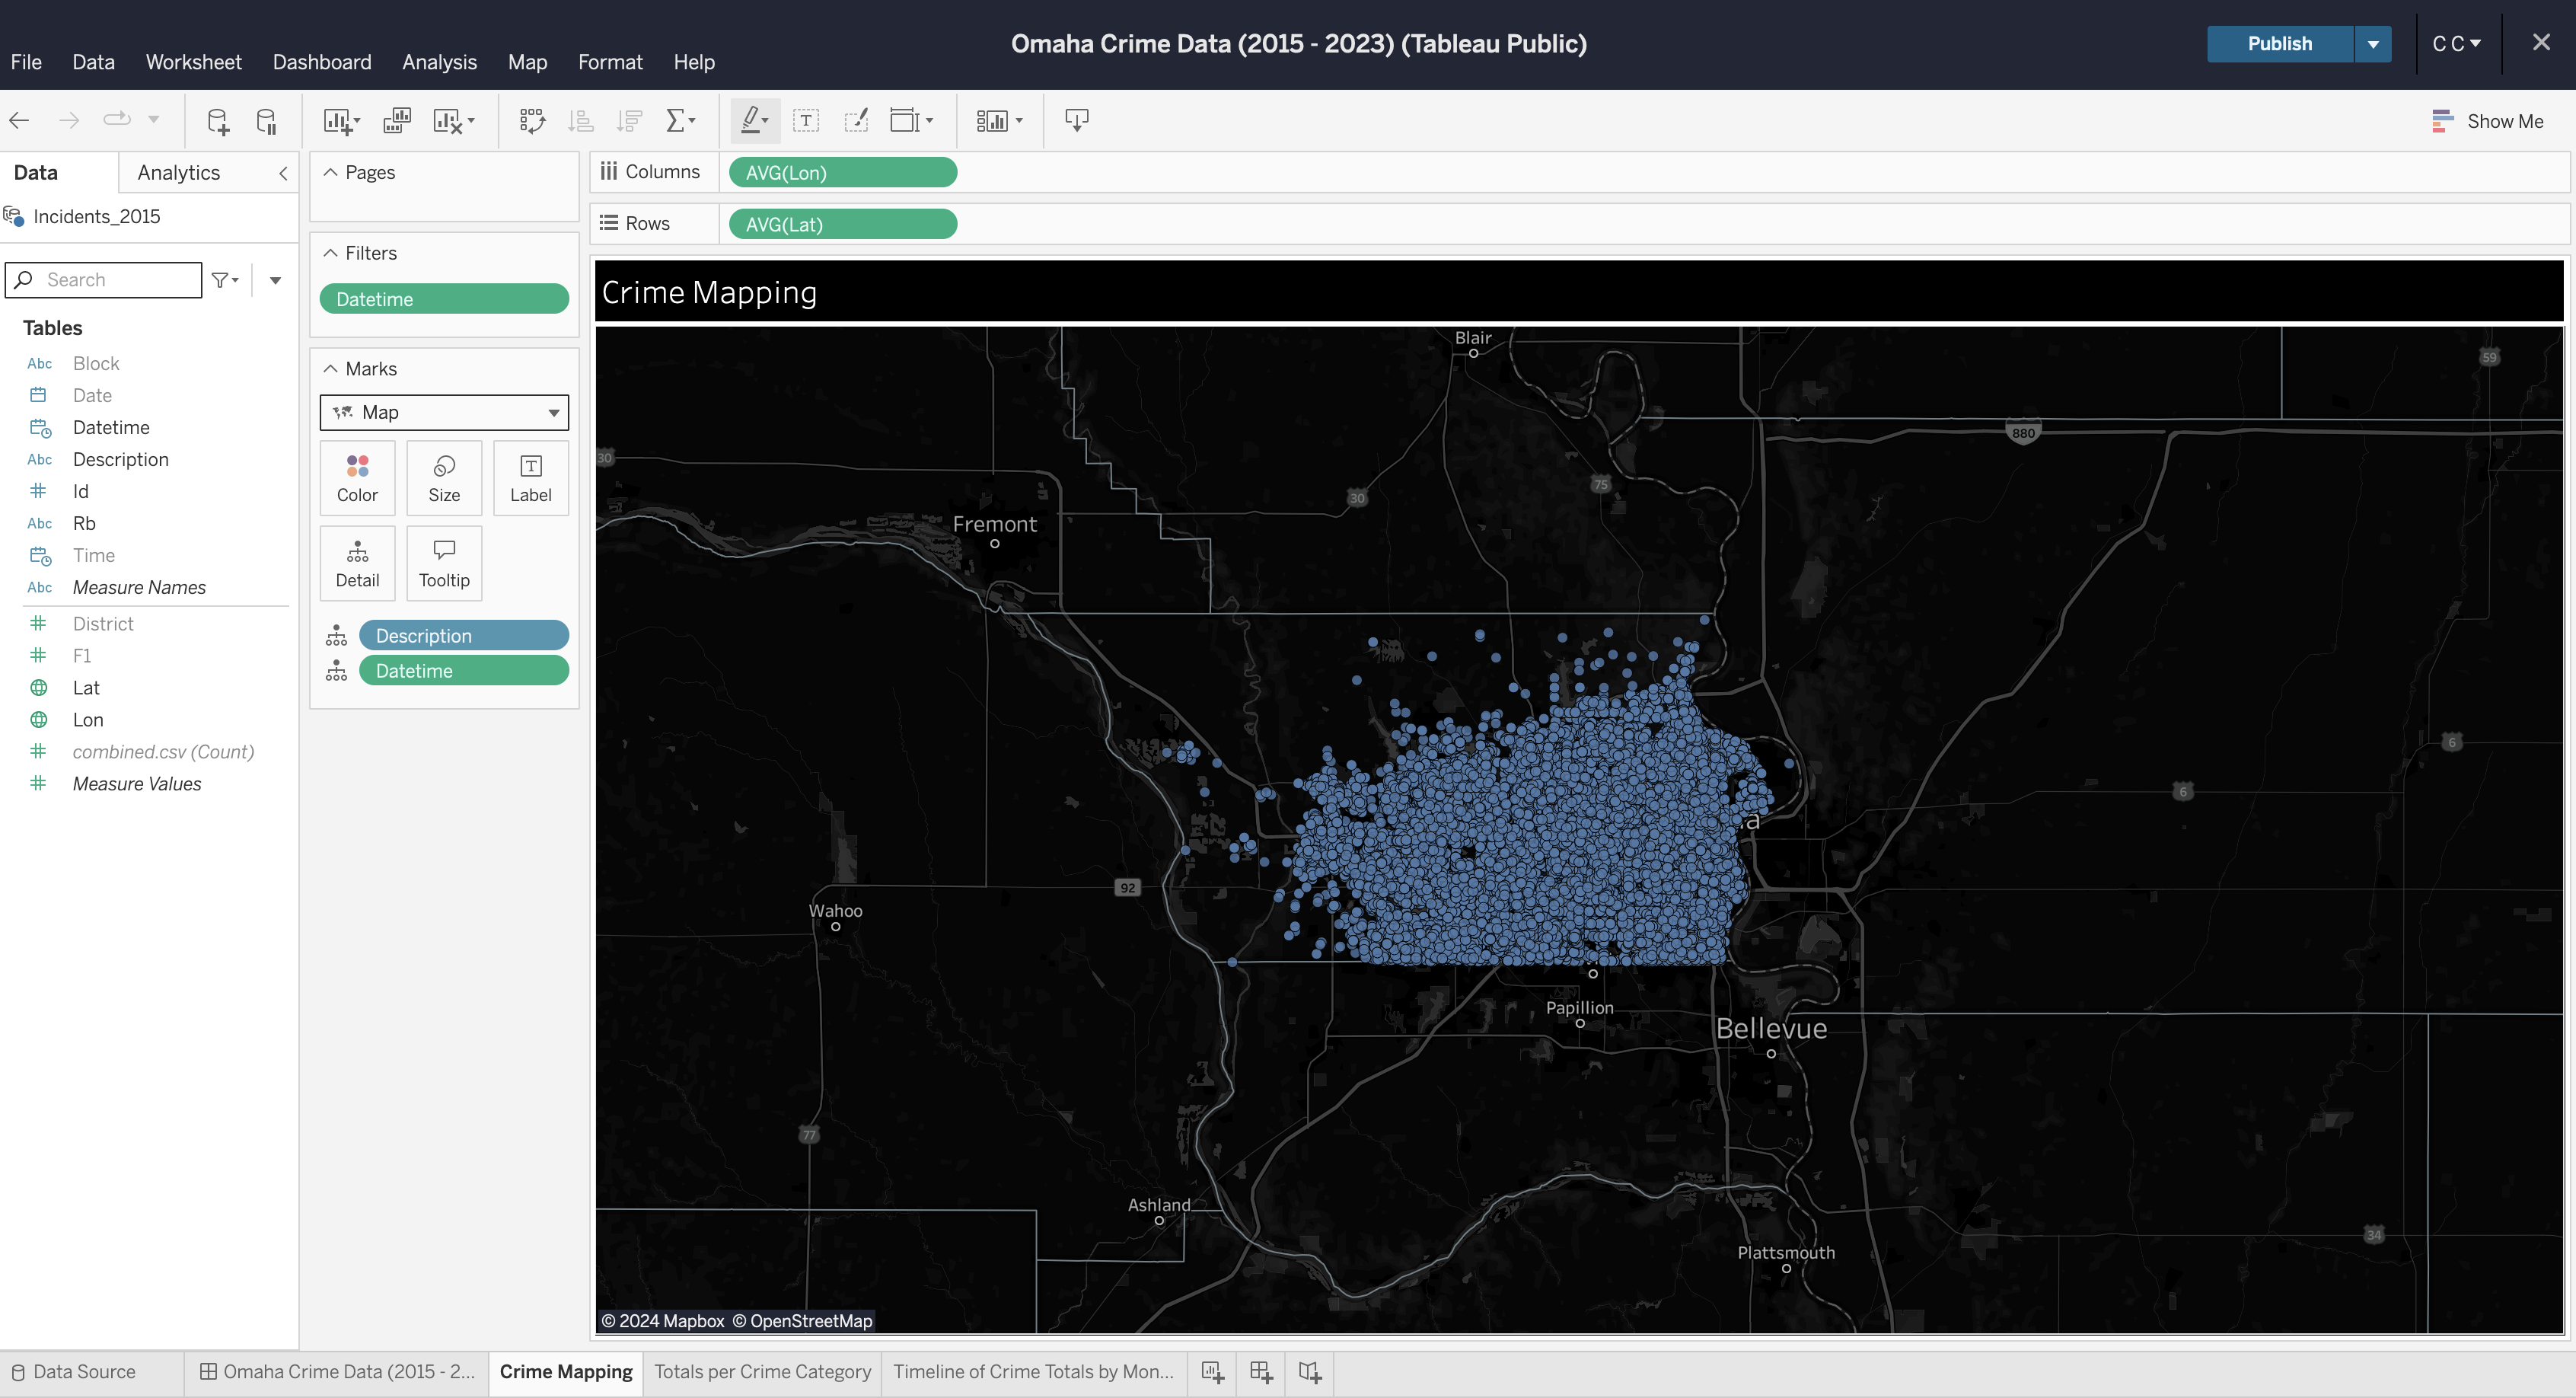 + +You can repeat this process for each visualization you want to create. +Explore your options by dragging data fields to different areas and by +opening the field options to explore what operations can be performed on +different data types (e.g., average, count, etc.). + +## Create Dashboard + +To create a dashboard, click the button on the toolbar at the bottom of +the screen. Within the dashboard, drag each sheet from the left side bar +onto the dashboard canvas. + +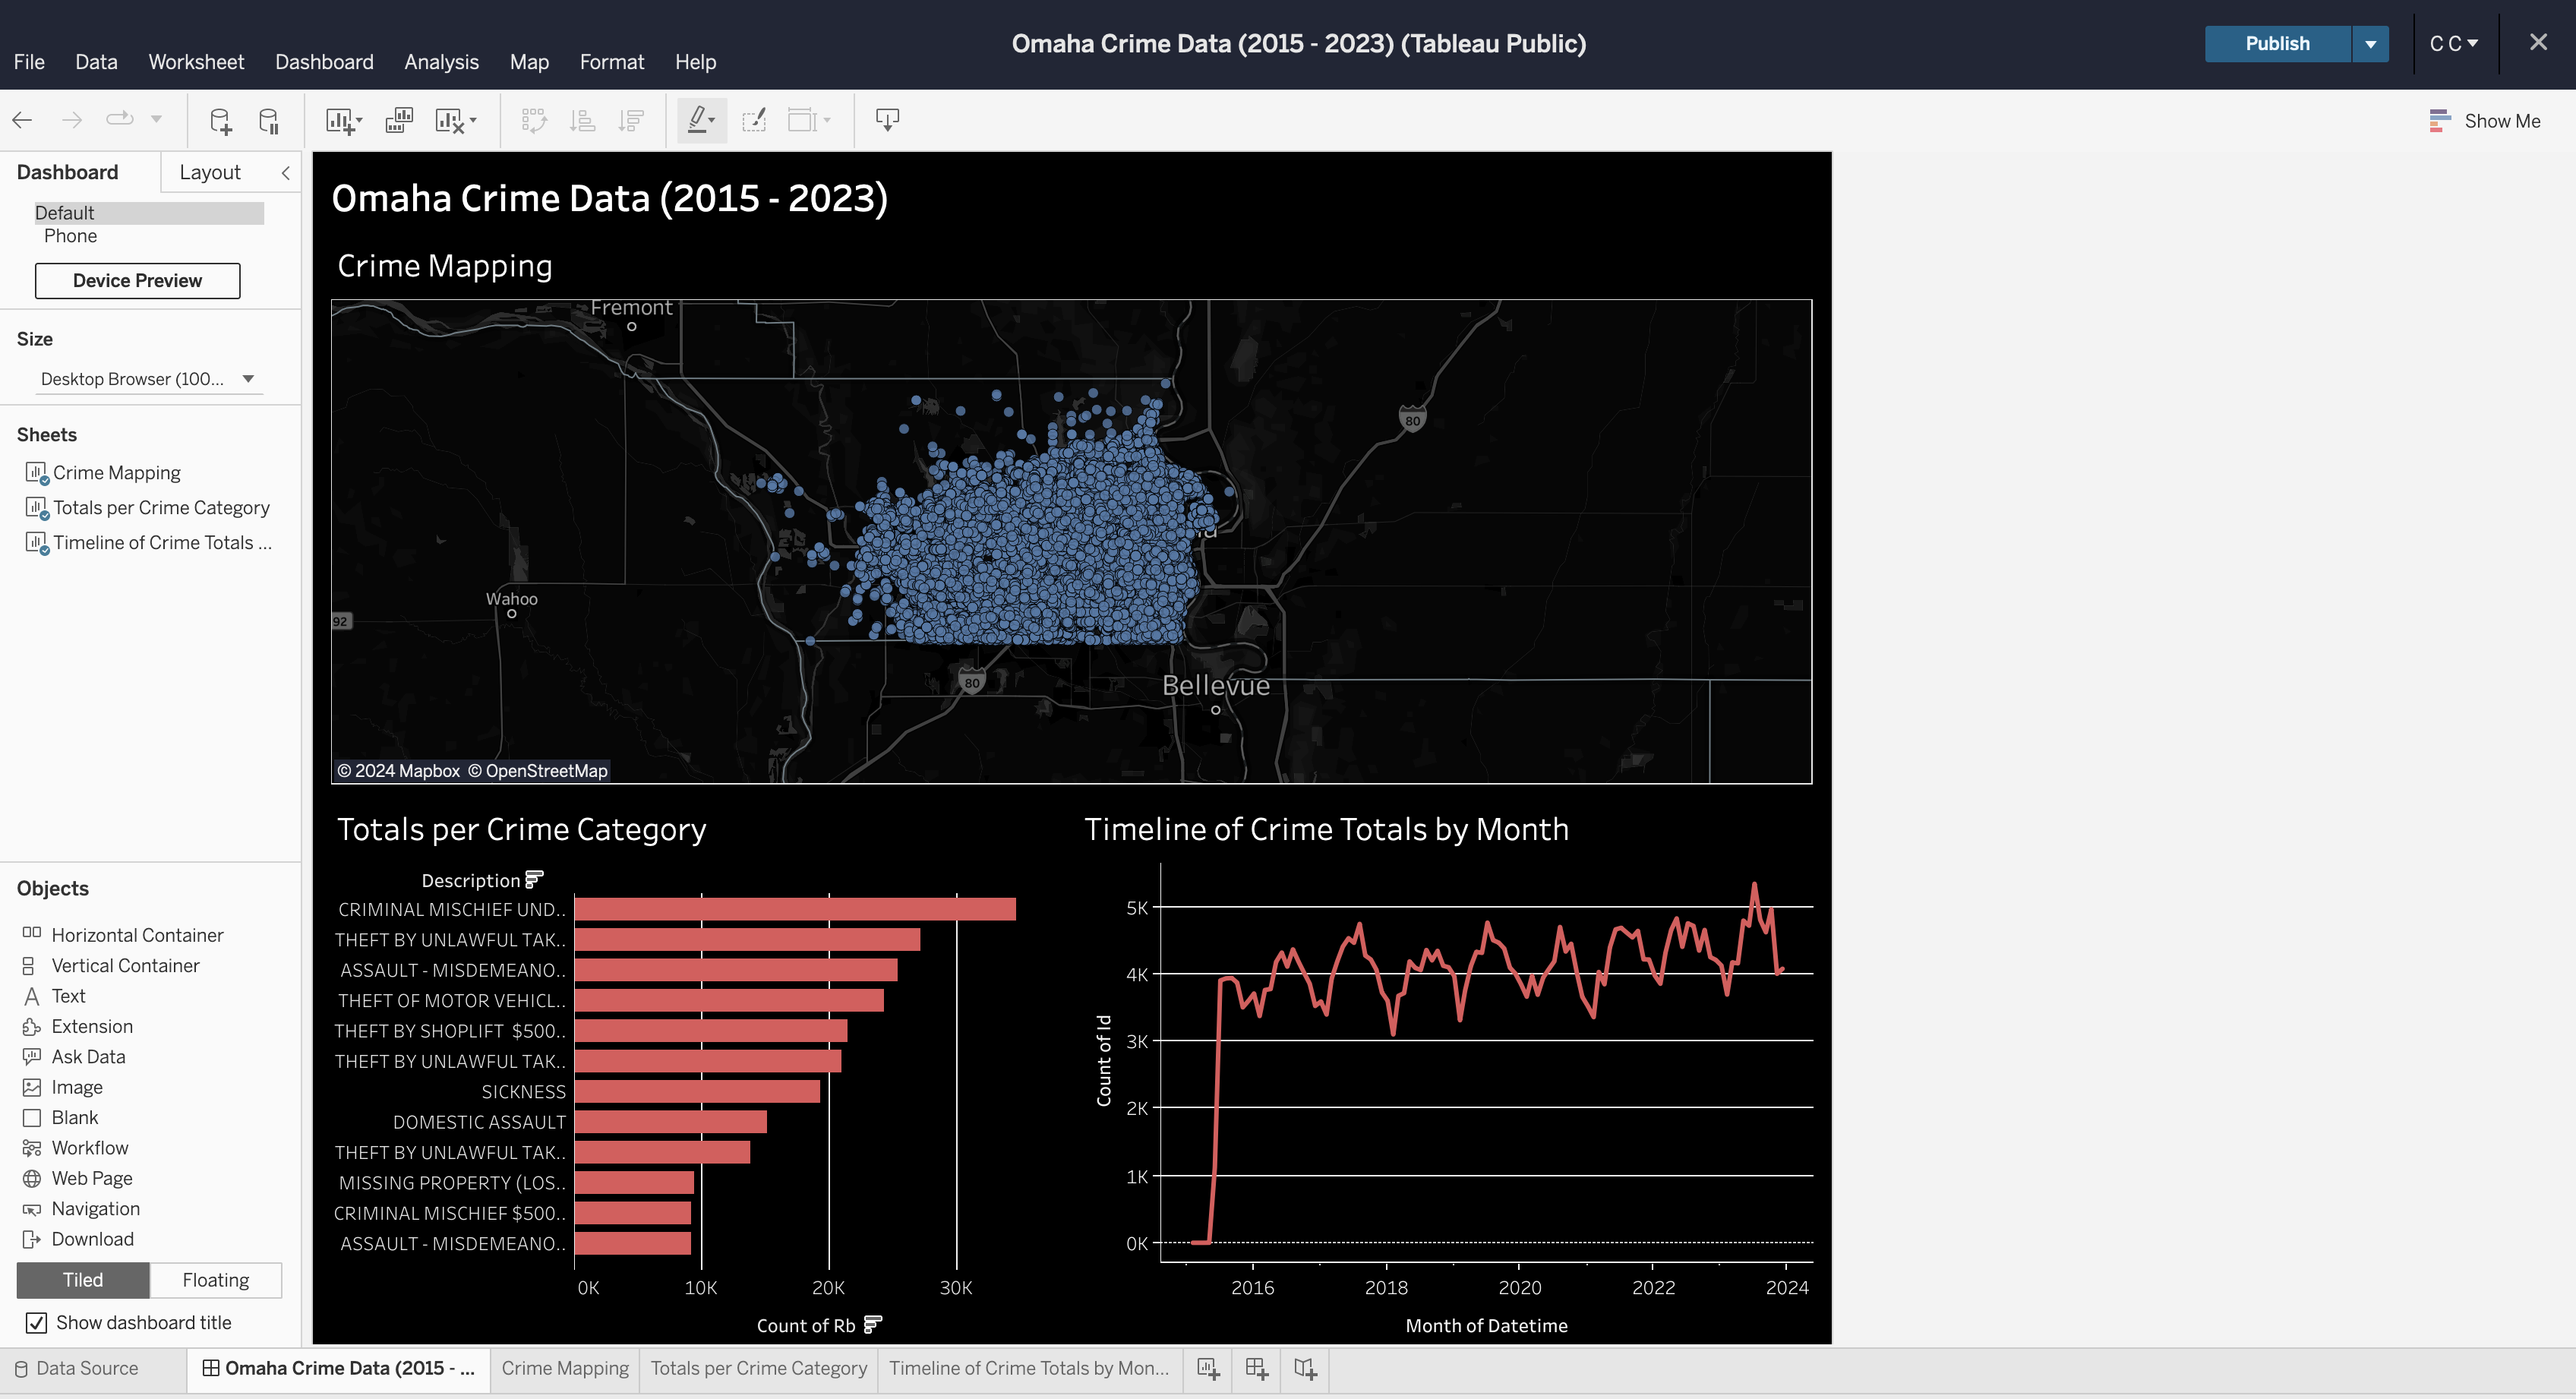 + +## Formatting + +You can explore a ton of different formatting options throughout the +worksheets and dashboard. Specifically for maps, you can alter the map +layers, background, and visible features through the `Map` +menu in the top file menu of the editing screen. + +In the finished dashboard below, I opted for a dark mode with a map that +showed county lines and city names. + +There\'s a ton of other options available to be used in a dashboard like +this, but this project shows a quick preview of what you can do in +Tableau Public. + + |