1
2
3
4
5
6
7
8
9
10
11
12
13
14
15
16
17
18
19
20
21
22
23
24
25
26
27
28
29
30
31
32
33
34
35
36
37
38
39
40
41
42
43
44
45
46
47
48
49
50
51
52
53
54
55
56
57
58
59
60
61
62
63
64
65
66
67
68
69
70
71
72
73
74
75
76
77
78
79
80
81
82
83
84
85
86
87
88
89
90
91
92
93
94
95
96
97
98
99
100
101
102
103
104
105
106
107
108
109
110
111
112
113
114
115
116
117
118
119
120
121
122
123
124
125
126
127
128
129
130
131
132
133
134
135
136
137
138
139
140
141
142
143
144
145
146
147
148
149
150
151
152
153
154
155
156
157
158
159
160
161
162
163
164
165
166
167
168
169
170
171
172
173
174
175
176
177
178
179
180
181
182
183
184
185
186
187
188
189
190
191
192
193
194
195
196
197
198
199
200
201
202
203
204
205
206
207
208
209
210
211
212
213
214
215
216
217
218
219
220
221
222
223
224
225
226
227
228
229
230
231
232
233
234
235
236
237
238
239
240
241
242
243
244
245
246
247
248
249
250
251
252
253
|
+++
date = 2022-03-03
title = "Maintaining a Personal Financial Database"
description = "Detailing my process for creating, maintaining, and utilizing a personal financial database."
draft = false
+++
## Personal Financial Tracking
For the last 6-ish years, I've tracked my finances in a spreadsheet. This is
common practice in the business world, but any good dev will cringe at the
thought of storing long-term data in a spreadsheet. A spreadsheet is not for
long-term storage or as a source of data to pull data/reports.
As I wanted to expand the functionality of my financial data (e.g., adding more
reports), I decided to migrate the data into a database. To run reports, I would
query the database and use a language like Python or Javascript to process the
data, perform calculations, and visualize the data.
## SQLite
When choosing the type of database I wanted to use for this project, I was split
between three options:
1. MySQL: The database I have the most experience with and have used for years.
2. PostgreSQL: A database I'm new to, but want to learn.
3. SQLite: A database that I've used for a couple projects and have moderate
experience.
I ended up choosing SQLite since it can be maintained within a single `.sqlite`
file, which allows me more flexibility for storage and backup. I keep this file
in my cloud storage and pull it up whenever needed.
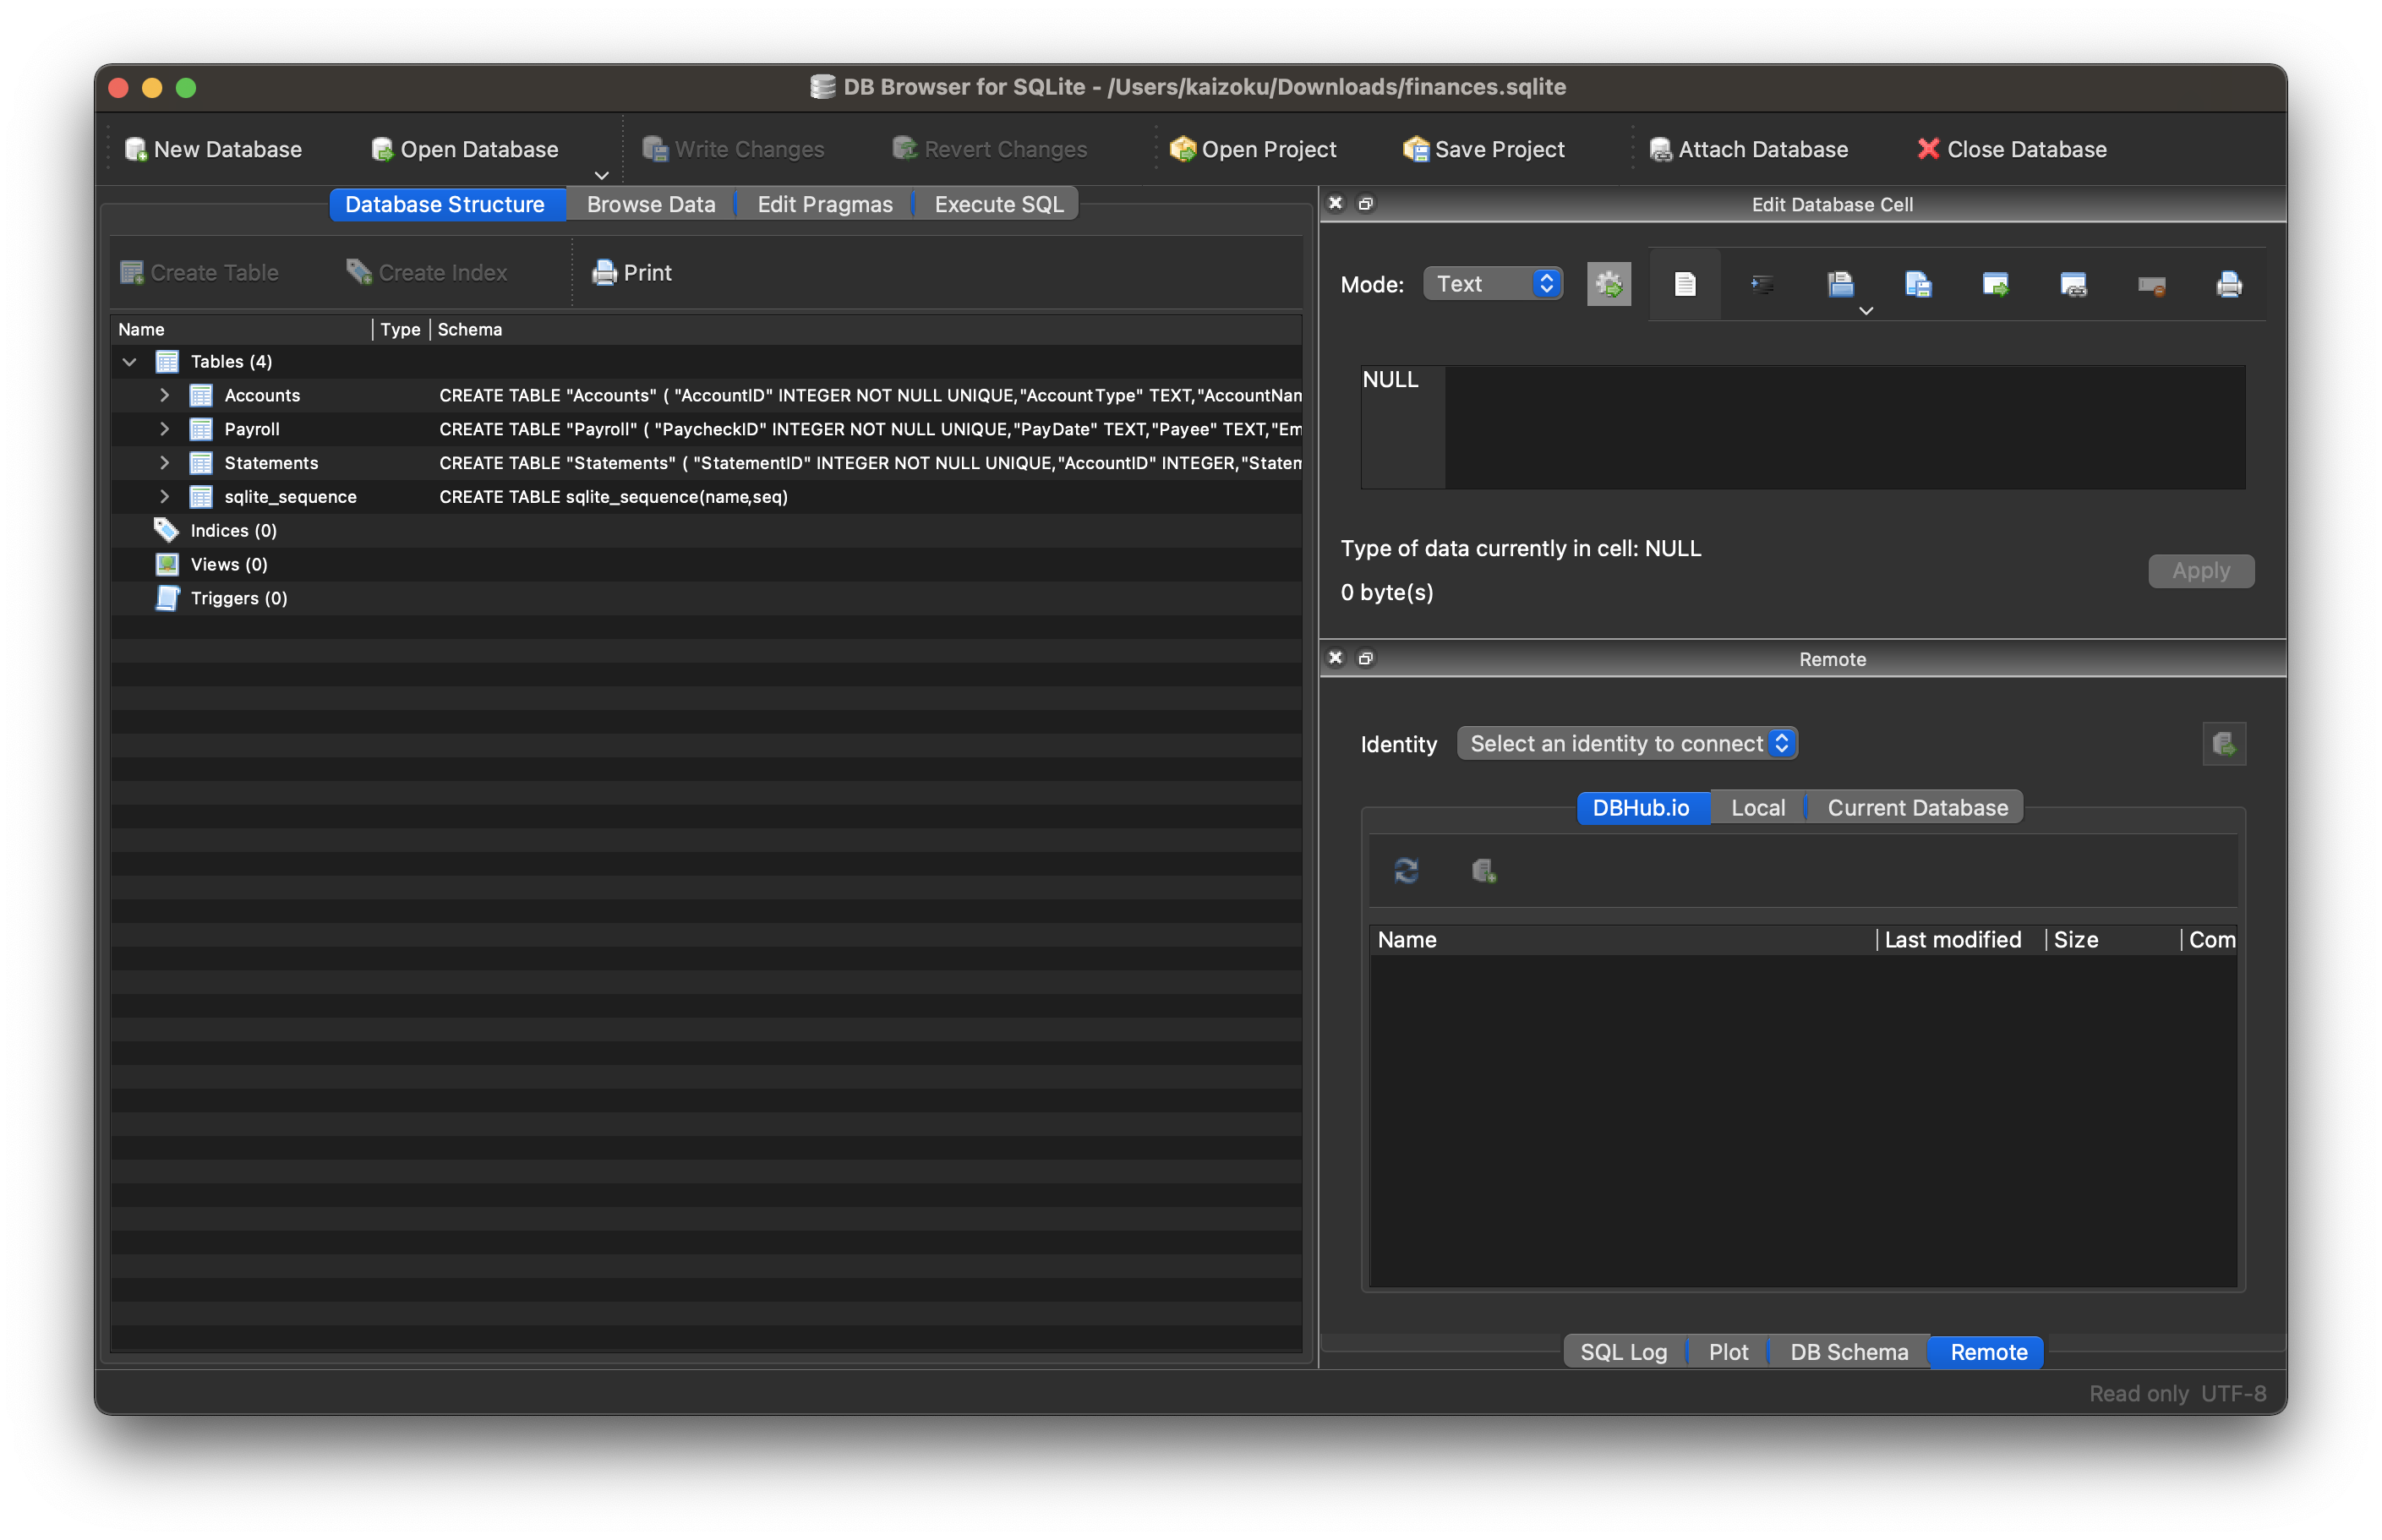
### GUI Editing
Since I didn't want to try and import 1000–1500 records into my new database
via the command line, I opted to use
[DB Browser for SQLite (DB4S)](https://sqlitebrowser.org/) as a GUI tool. This
application is excellent, and I don't see myself going back to the CLI
when working in this database.
DB4S allows you to copy a range of cells from a spreadsheet and paste it
straight into the SQL table. I used this process for all 36 accounts, 1290
account statements, and 126 pay statements. Overall, I'm guessing this took
anywhere between 4–8 hours. In comparison, it probably took me 2-3 days to
initially create the spreadsheet.
### Schema
The schema for this database is actually extremely simple and involves only
three tables (for now):
1. Accounts
2. Statements
3. Payroll
**Accounts**
The Accounts table contains summary information about an account, such as a car
loan or a credit card. By viewing this table, you can find high-level data, such
as interest rate, credit line, or owner.
```sql
CREATE TABLE "Accounts" (
"AccountID" INTEGER NOT NULL UNIQUE,
"AccountType" TEXT,
"AccountName" TEXT,
"InterestRate" NUMERIC,
"CreditLine" NUMERIC,
"State" TEXT,
"Owner" TEXT,
"Co-Owner" TEXT,
PRIMARY KEY("AccountID" AUTOINCREMENT)
)
```
**Statements**
The Statements table uses the same unique identifier as the Accounts table,
meaning you can join the tables to find a monthly statement for any of the
accounts listed in the Accounts table. Each statement has an account ID,
statement date, and total balance.
```sql
CREATE TABLE "Statements" (
"StatementID" INTEGER NOT NULL UNIQUE,
"AccountID" INTEGER,
"StatementDate" INTEGER,
"Balance" NUMERIC,
PRIMARY KEY("StatementID" AUTOINCREMENT),
FOREIGN KEY("AccountID") REFERENCES "Accounts"("AccountID")
)
```
**Payroll**
The Payroll table is a separate entity, unrelated to the Accounts or Statements
tables. This table contains all information you would find on a pay statement
from an employer. As you change employers or obtain new perks/benefits, just add
new columns to adapt to the new data.
```sql
CREATE TABLE "Payroll" (
"PaycheckID" INTEGER NOT NULL UNIQUE,
"PayDate" TEXT,
"Payee" TEXT,
"Employer" TEXT,
"JobTitle" TEXT,
"IncomeRegular" NUMERIC,
"IncomePTO" NUMERIC,
"IncomeHoliday" NUMERIC,
"IncomeBonus" NUMERIC,
"IncomePTOPayout" NUMERIC,
"IncomeReimbursements" NUMERIC,
"FringeHSA" NUMERIC,
"FringeStudentLoan" NUMERIC,
"Fringe401k" NUMERIC,
"PreTaxMedical" NUMERIC,
"PreTaxDental" NUMERIC,
"PreTaxVision" NUMERIC,
"PreTaxLifeInsurance" NUMERIC,
"PreTax401k" NUMERIC,
"PreTaxParking" NUMERIC,
"PreTaxStudentLoan" NUMERIC,
"PreTaxOther" NUMERIC,
"TaxFederal" NUMERIC,
"TaxSocial" NUMERIC,
"TaxMedicare" NUMERIC,
"TaxState" NUMERIC,
PRIMARY KEY("PaycheckID" AUTOINCREMENT)
)
```
### Python Reporting
Once I created the database tables and imported all my data, the only step left
was to create a process to report and visualize on various aspects of the data.
In order to explore and create the reports I'm interested in, I utilized a
two-part process involving Jupyter Notebooks and Python scripts.
#### Step 1: Jupyter Notebooks
When I need to explore data, try different things, and re-run my code
cell-by-cell, I use Jupyter Notebooks. For example, I explored the `Accounts`
table until I found the following useful information:
```python
import sqlite3
import pandas as pd
import matplotlib
# Set up database filename and connect
db = "finances.sqlite"
connection = sqlite3.connect(db)
df = pd.read_sql_query("SELECT * FROM Accounts", connection)
# Set global matplotlib variables
%matplotlib inline
matplotlib.rcParams['text.color'] = 'white'
matplotlib.rcParams['axes.labelcolor'] = 'white'
matplotlib.rcParams['xtick.color'] = 'white'
matplotlib.rcParams['ytick.color'] = 'white'
matplotlib.rcParams['legend.labelcolor'] = 'black'
# Display graph
df.groupby(['AccountType']).sum().plot.pie(title='Credit Line by Account Type', y='CreditLine', figsize=(5,5), autopct='%1.1f%%')
```
#### Step 2: Python Scripts
Once I explored enough through the notebooks and had a list of reports I wanted,
I moved on to create a Python project with the following structure:
```
finance/
├── notebooks/
│ │ ├── account_summary.ipynb
│ │ ├── account_details.ipynb
│ │ └── payroll.ipynb
├── public/
│ │ ├── image-01.png
│ │ └── image-0X.png
├── src/
│ └── finance.sqlite
├── venv/
├── _init.py
├── database.py
├── process.py
├── requirements.txt
└── README.md
```
This structure allows me to:
1. Compile all required python packages into `requirements.txt` for easy
installation if I move to a new machine.
2. Activate a virtual environment in `venv/` so I don't need to maintain a
system-wide Python environment just for this project.
3. Keep my `notebooks/` folder to continuously explore the data as I see fit.
4. Maintain a local copy of the database in `src/` for easy access.
5. Export reports, images, HTML files, etc. to `public/`.
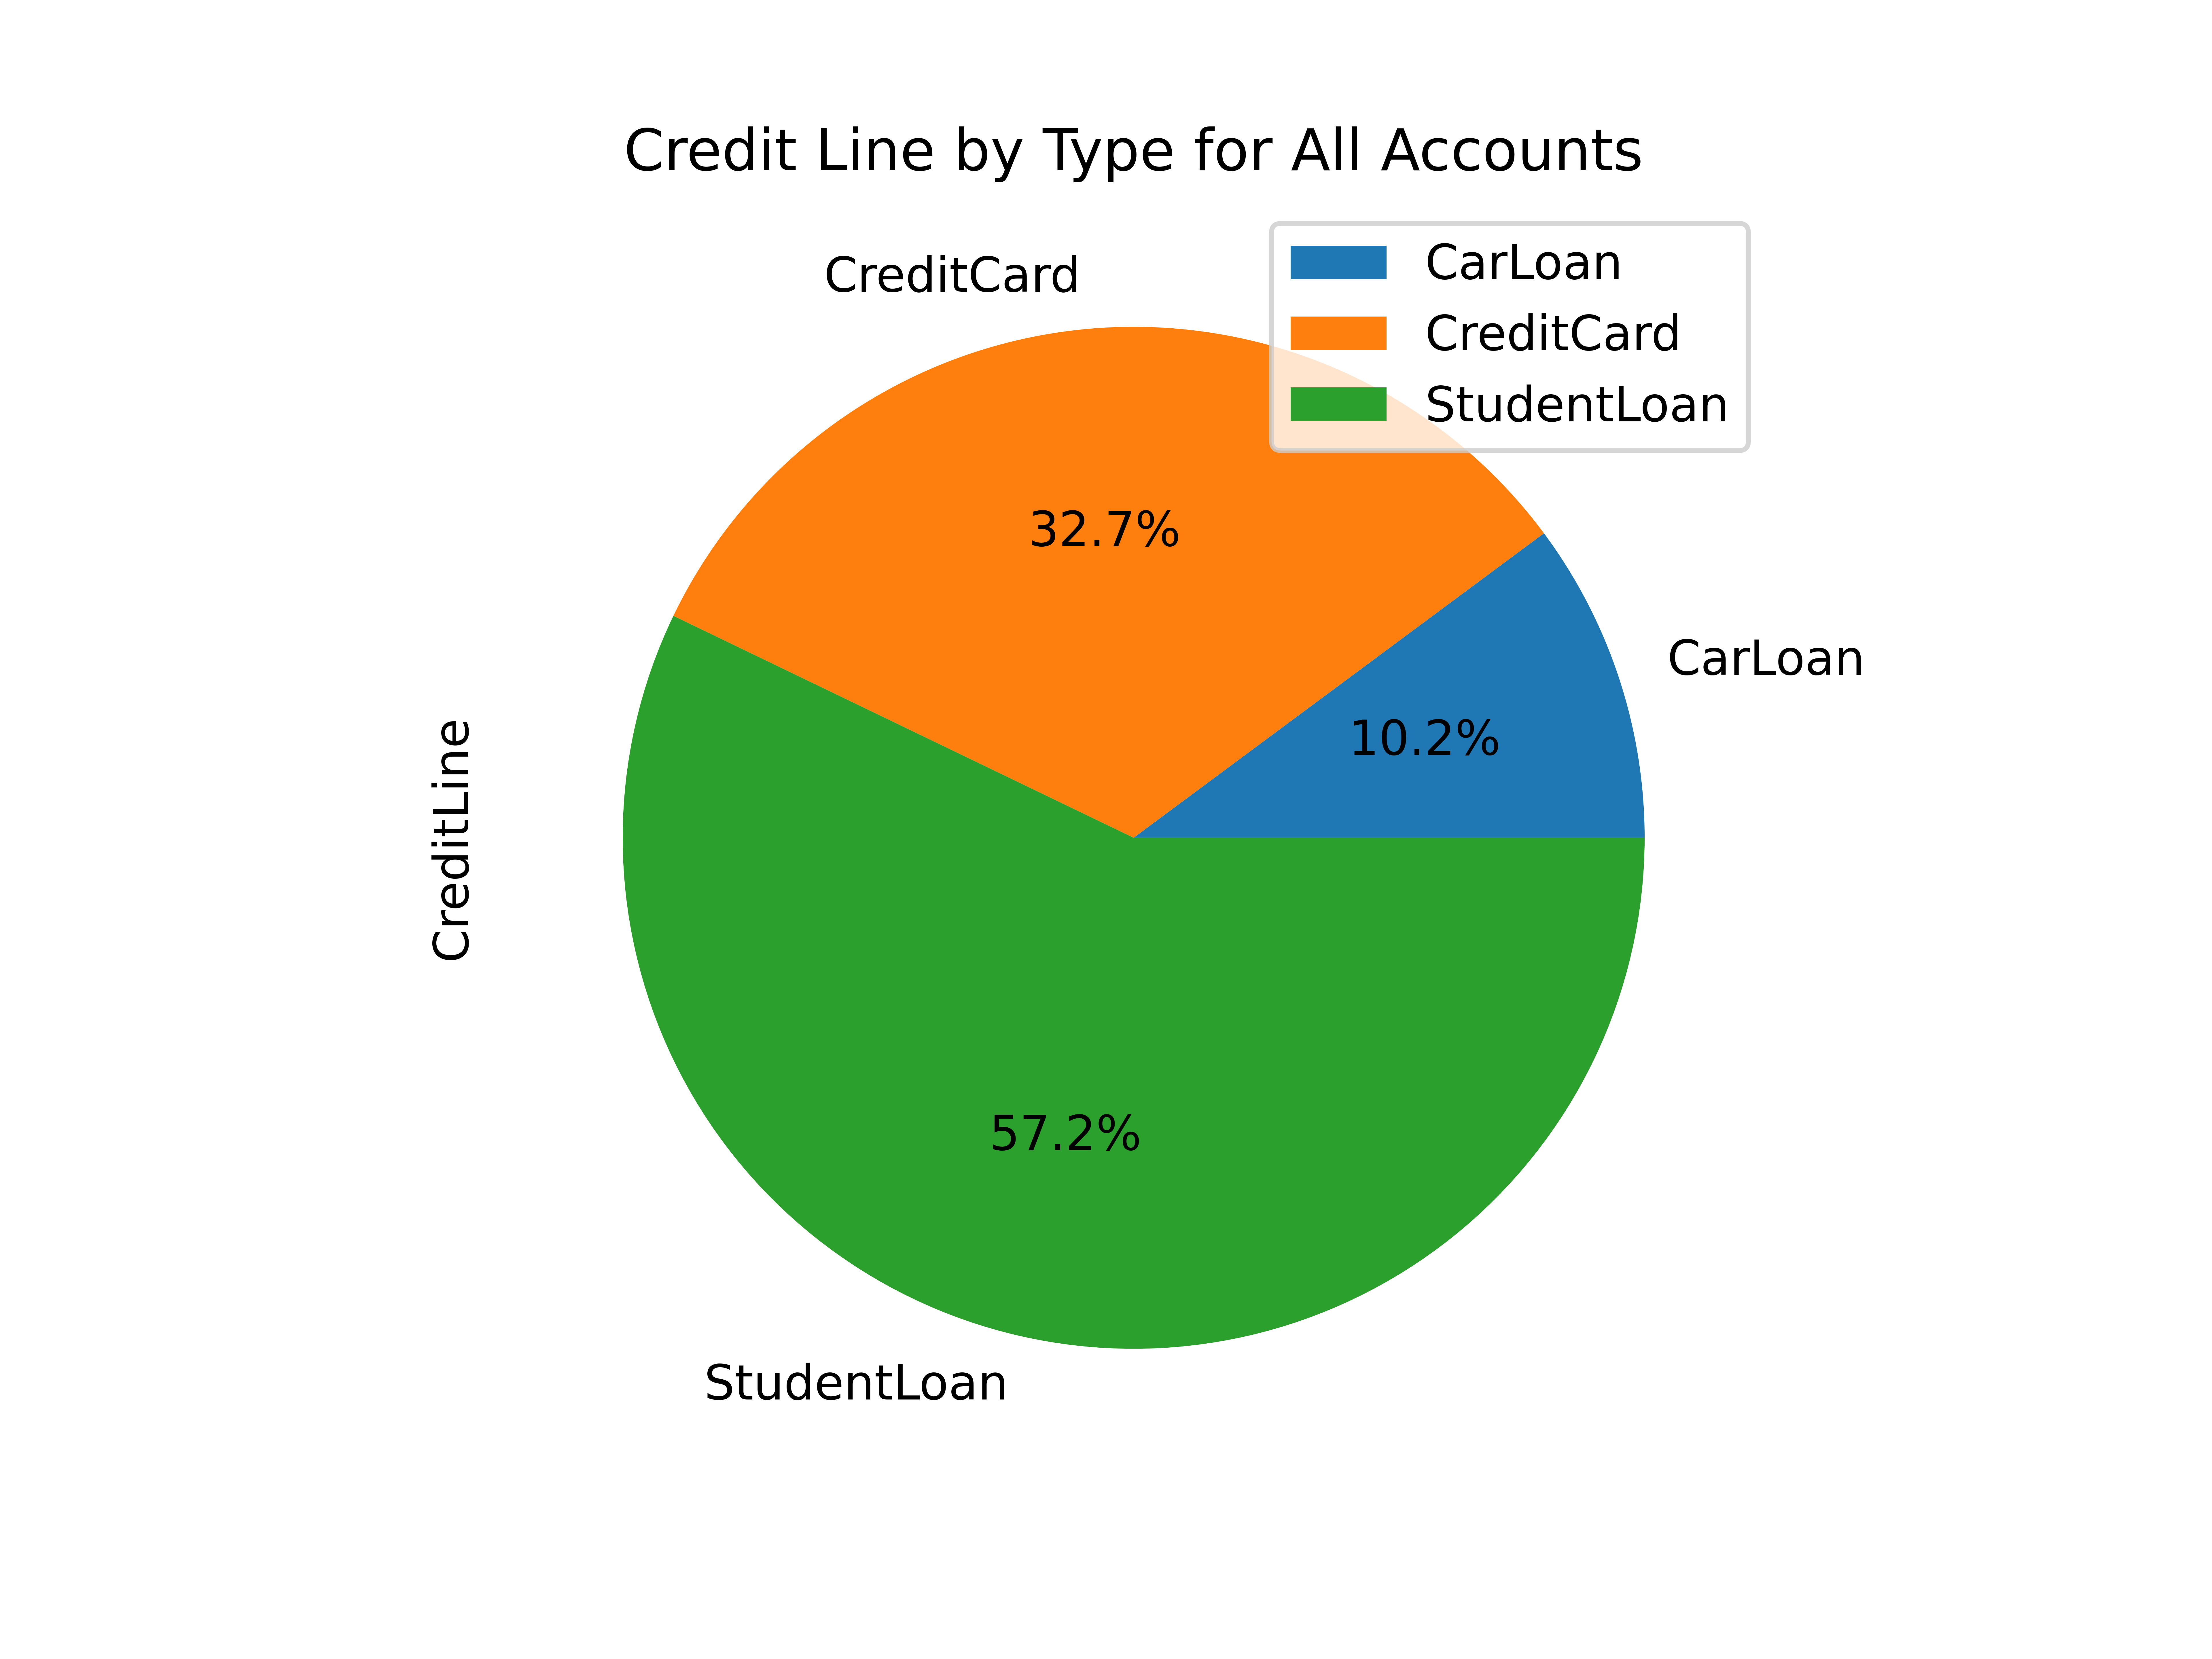
Now, onto the differences between the code in a Jupyter Notebook and the actual
Python files. To create the report in the Notebook snippet above, I created the
following function inside `process.py`:
```python
# Create summary pie chart
def summary_data(accounts: pandas.DataFrame) -> None:
accounts_01 = accounts[accounts["Owner"] == "Person01"]
accounts_02 = accounts[accounts["Owner"] == "Person02"]
for x in range(1, 4):
if x == 1:
df = accounts
account_string = "All Accounts"
elif x == 2:
df = accounts_01
account_string = "Person01's Accounts"
elif x == 3:
df = accounts_02
account_string = "Person02's Accounts"
print(f"Generating pie chart summary image for {account_string}...")
summary_chart = (
df.groupby(["AccountType"])
.sum()
.plot.pie(
title=f"Credit Line by Type for {account_string}",
y="CreditLine",
autopct="%1.1f%%",
)
)
summary_chart.figure.savefig(f"public/summary_chart_{x}.png", dpi=1200)
```
The result? A high-quality pie chart that is read directly by the
`public/index.html` template I use.
Other charts generated by this project include:
- Charts of account balances over time.
- Line chart of effective tax rate (taxes divided by taxable income).
- Salary projections and error limits using past income and inflation rates.
- Multi-line chart of gross income, taxable income, and net income.
The best thing about this project? I can improve it at any given time, shaping
it into whatever helps me the most for that time. I imagine that I will be
introducing an asset tracking table soon to track the depreciating value of
cars, houses, etc. Who knows what's next?
|
