1
2
3
4
5
6
7
8
9
10
11
12
13
14
15
16
17
18
19
20
21
22
23
24
25
26
27
28
29
30
31
32
33
34
35
36
37
38
39
40
41
42
43
44
45
46
47
48
49
50
51
52
53
54
55
56
57
58
59
60
61
62
63
64
65
66
67
68
69
70
71
72
73
74
75
76
77
78
79
80
81
82
83
84
85
86
87
88
89
90
91
92
93
94
95
96
97
98
99
100
101
102
103
104
105
106
107
108
109
110
111
112
113
114
115
116
117
118
119
120
121
122
123
124
125
126
127
128
129
130
131
132
133
134
135
136
137
138
139
140
141
142
143
144
145
146
147
148
149
150
151
152
153
154
155
156
157
158
159
160
161
162
163
164
165
166
167
168
169
170
171
172
173
174
175
176
177
178
179
180
181
182
|
+++
date = 2020-07-20
title = "Data Exploration: Video Games Sales"
description = ""
draft = false
+++
# Background Information
This dataset (obtained from
[Kaggle](https://www.kaggle.com/gregorut/videogamesales/data)) contains a list
of video games with sales greater than 100,000 copies. It was generated by a
scrape of vgchartz.com.
Fields include:
- Rank: Ranking of overall sales
- Name: The game name
- Platform: Platform of the game release (i.e. PC,PS4, etc.)
- Year: Year of the game's release
- Genre: Genre of the game
- Publisher: Publisher of the game
- NA~Sales~: Sales in North America (in millions)
- EU~Sales~: Sales in Europe (in millions)
- JP~Sales~: Sales in Japan (in millions)
- Other~Sales~: Sales in the rest of the world (in millions)
- Global~Sales~: Total worldwide sales.
There are 16,598 records. 2 records were dropped due to incomplete information.
# Import the Data
``` python
# Import the Python libraries we will be using
import pandas as pd
import numpy as np
import seaborn as sns; sns.set()
import matplotlib.pyplot as plt
# Load the file using the path to the downloaded file
file = r'video_game_sales.csv'
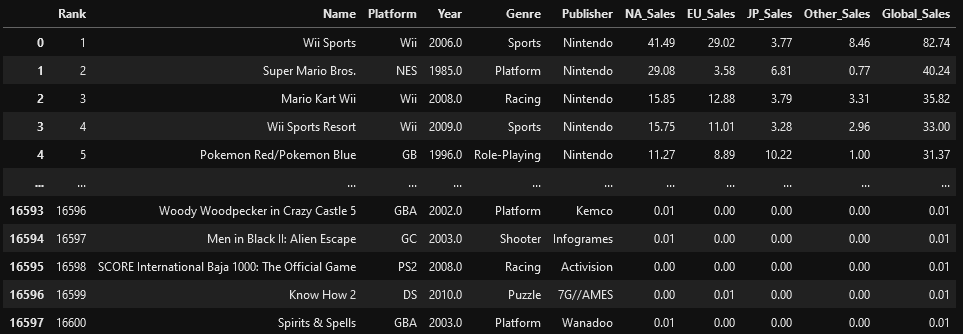
df = pd.read_csv(file)
df
```
# Explore the Data
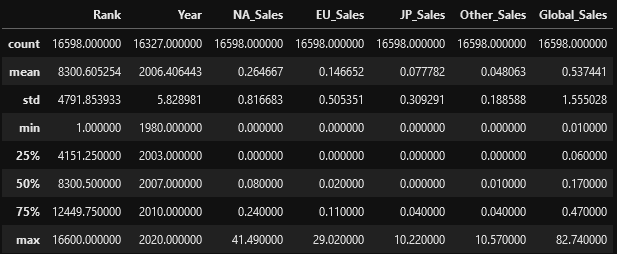
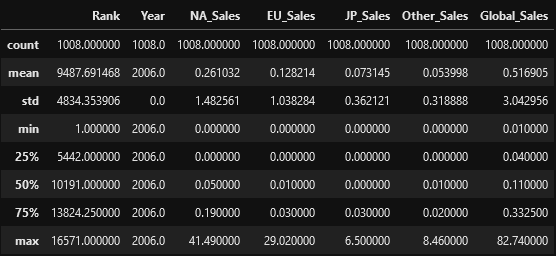
``` python
# With the description function, we can see the basic stats. For example, we can
# also see that the 'Year' column has some incomplete values.
df.describe()
```
``` python
# This function shows the rows and columns of NaN values. For example, df[179,3] = nan
np.where(pd.isnull(df))
(array([179, ..., 16553], dtype=int64),
array([3, ..., 5], dtype=int64))
```
# Visualize the Data
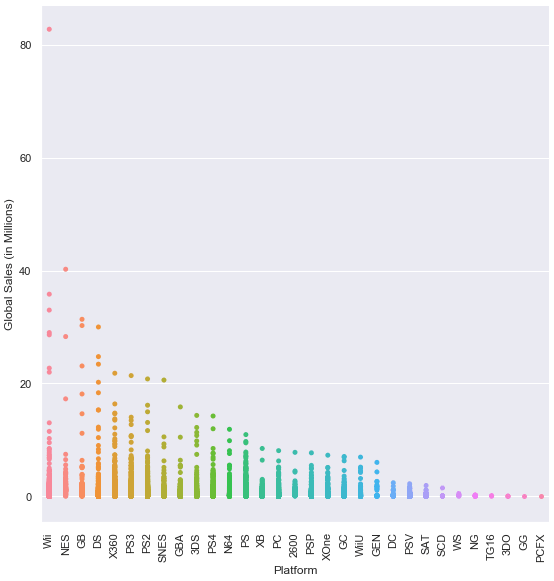
``` python
# This function plots the global sales by platform
sns.catplot(x='Platform', y='Global_Sales', data=df, jitter=False).set_xticklabels(rotation=90)
```
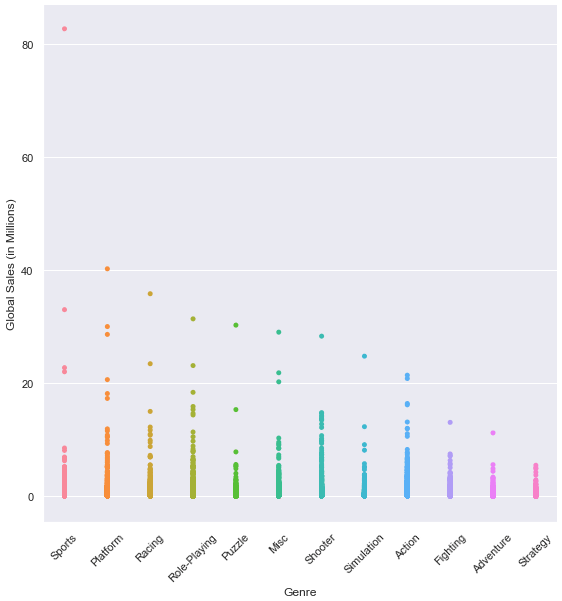
``` python
# This function plots the global sales by genre
sns.catplot(x='Genre', y='Global_Sales', data=df, jitter=False).set_xticklabels(rotation=45)
```
``` python
# This function plots the global sales by year
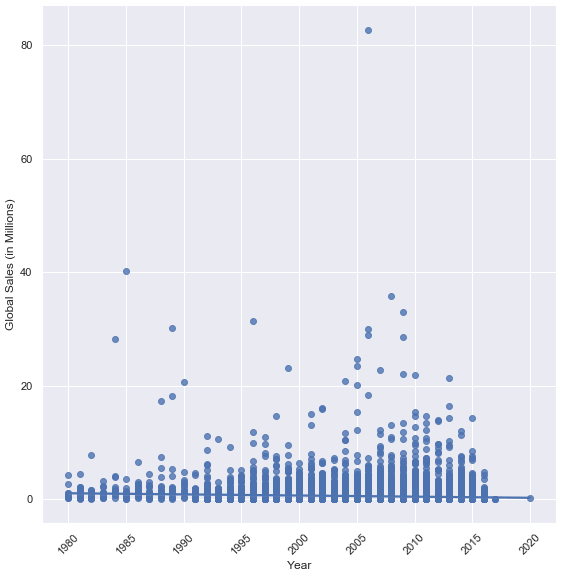
sns.lmplot(x='Year', y='Global_Sales', data=df).set_xticklabels(rotation=45)
```
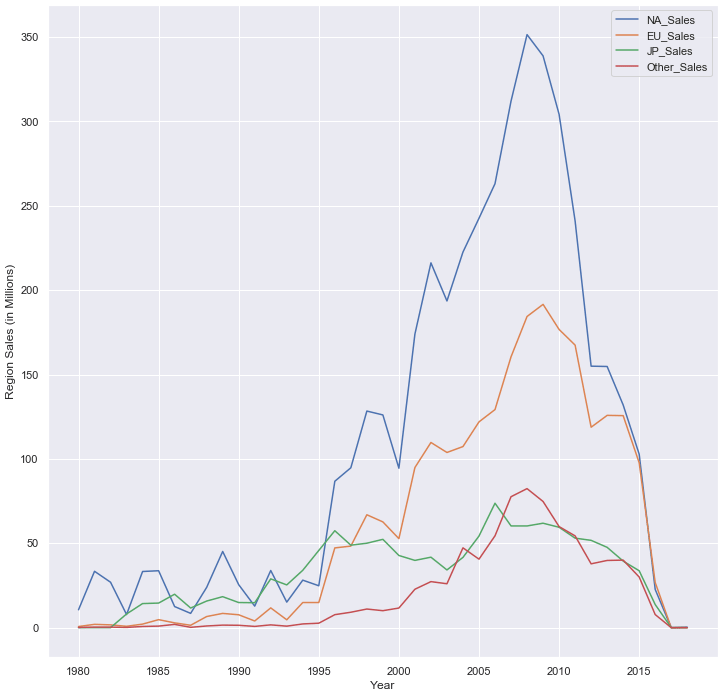
``` python
# This function plots four different lines to show sales from different regions.
# The global sales plot line is commented-out, but can be included for comparison
df2 = df.groupby('Year').sum()
years = range(1980,2019)
a = df2['NA_Sales']
b = df2['EU_Sales']
c = df2['JP_Sales']
d = df2['Other_Sales']
# e = df2['Global_Sales']
fig, ax = plt.subplots(figsize=(12,12))
ax.set_ylabel('Region Sales (in Millions)')
ax.set_xlabel('Year')
ax.plot(years, a, label='NA_Sales')
ax.plot(years, b, label='EU_Sales')
ax.plot(years, c, label='JP_Sales')
ax.plot(years, d, label='Other_Sales')
# ax.plot(years, e, label='Global_Sales')
ax.legend()
plt.show()
```
## Investigate Outliers
``` python
# Find the game with the highest sales in North America
df.loc[df['NA_Sales'].idxmax()]
Rank 1
Name Wii Sports
Platform Wii
Year 2006
Genre Sports
Publisher Nintendo
NA_Sales 41.49
EU_Sales 29.02
JP_Sales 3.77
Other_Sales 8.46
Global_Sales 82.74
Name: 0, dtype: object
# Explore statistics in the year 2006 (highest selling year)
df3 = df[(df['Year'] == 2006)]
df3.describe()
```
``` python
# Plot the results of the previous dataframe (games from 2006) - we can see the year's results were largely carried by Wii Sports
sns.catplot(x="Genre", y="Global_Sales", data=df3, jitter=False).set_xticklabels(rotation=45)
```
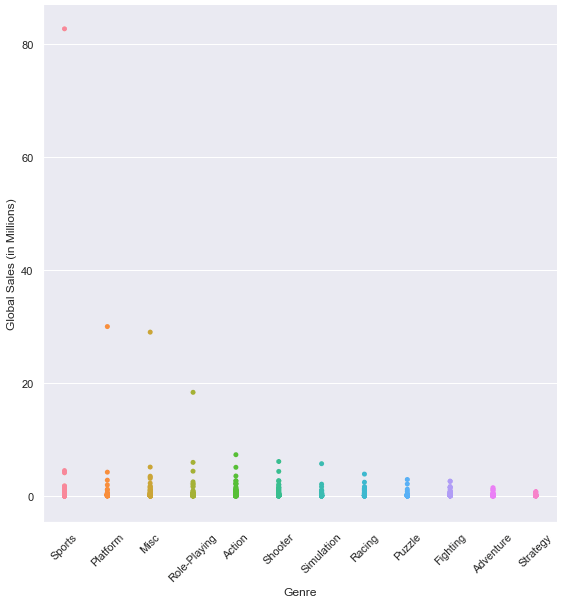
``` python
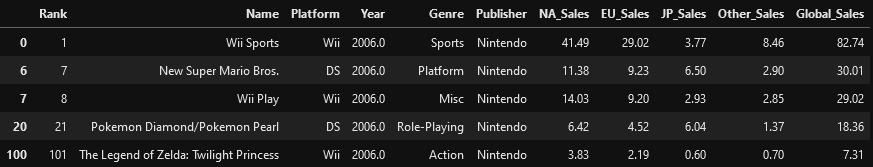
# We can see 4 outliers in the graph above, so let's get the top 5 games from that dataframe
# The results below show that Nintendo had all top 5 games (3 on the Wii and 2 on the DS)
df3.sort_values(by=['Global_Sales'], ascending=False).head(5)
```
# Discussion
The purpose of exploring datasets is to ask questions, answer questions, and
discover intelligence that can be used to inform decision-making. So, what have
we found in this dataset?
Today we simply explored a publicly-available dataset to see what kind of
information it contained. During that exploration, we found that video game
sales peaked in 2006. That peak was largely due to Nintendo, who sold the top 5
games in 2006 and has a number of games in the top-10 list for the years
1980-2020. Additionally, the top four platforms by global sales (Wii, NES, GB,
DS) are owned by Nintendo.
We didn't explore everything this dataset has to offer, but we can tell from a
brief analysis that Nintendo seems to rule sales in the video gaming world.
Further analysis could provide insight into which genres, regions, publishers,
or world events are correlated with sales.
|
